The future is here. Our condolences to the family, fans and well-wishers of KitKat, the 9-year-old tabby cat, a beloved fixture of Randa’s Market in the Mission District of San Francisco.
The local community reaction is strong: slogans such as “Kill a Waymo! Save a cat!” reflect anger and fear, not just sadness. The incident may trigger regulatory scrutiny of Autonomous Vehicles (AVs).
Of course, the incident isn’t just about a pet — it touches on AV safety, public trust in urban tech deployments, and how the community perceives tech vs. local culture. One small step for man, a giant step for mankind as they say – sometimes there are missteps on the way.
AVs are here to stay and will continue to roll out over the next decade. Safety will not be as much of a problem as we think in the future though there is no incident free perfect world. Tech is not perfect. But the direction is positive in terms of the improvement in key safety metrics.
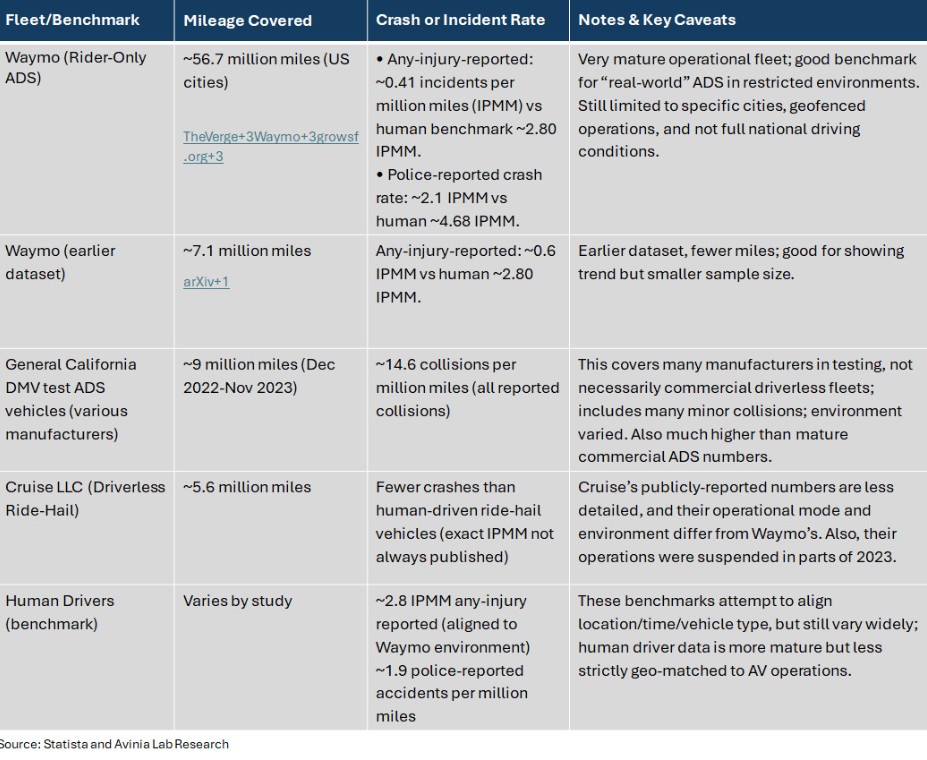
A dataset found that autonomous vehicles (including driverless/ADS and test vehicles) logged 132 collisions in California during one year (Dec 2022–Nov 2023) over about 9 million miles driven, equating to ~ 14.6 crashes per million vehicle-miles travelled. [1]
A legal-analysis page cites that during 2022 in California, AVs drove about 5.7 million miles and were involved in 150 reported collisions: ~ 26.3 crashes per million miles.
For one fully autonomous fleet (Waymo), a study [2] over 56.7 million miles through January 2025 found that against human driver benchmarks, their “any-injury-reported” crash rate was ~0.6 incidents per million miles vs ~2.80 for humans (≈ 80% reduction).
Earlier comparative numbers cited ~9.1 crashes per million miles for self-driving cars vs ~4.1 per million miles for conventional cars.
The key takeaways can be summarized as follows:
- The higher crash-per-mile numbers in some test-vehicle datasets (e.g., ~26.3 per million miles) likely reflect earlier-stage deployments, constrained geographies, and many “minor” incidents (including low-speed events).
- The numbers differ widely because of definitions (test vehicles vs commercial ride-hailing AVs), locations (urban vs highway), operating conditions (supervised vs unsupervised), what constitutes a “crash” (minor vs serious), and how mileage is reported.
- Many AVs are still in pilot/test mode, with safety drivers, limited geofenced areas, and lower speeds; comparing directly to the broader human-driver fleet is challenging.
- For mature fleets like Waymo’s, the data points to substantially lower serious crash/injury rates compared to human drivers—but the absolute crash count is still non-zero, and mileage is still much smaller than human-driven miles.
- The real metric for societal benefit is not just crash count but injuries/fatalities avoided, types of crashes, severity, and how the technology scales into more complex environments. The lower serious-injury crash rates (e.g., Waymo’s ~0.02 serious-injury+ per million miles in some analyses) is evidence of progress.
Tabby was a wakeup call that there is a lot to be done to prioritize safety for all roadway users. Godspeed, Tabby.