Airport traffic forecasting has traditionally been an exercise in false precision. Master plans, capital programmes, and terminal sizing decisions worth hundreds of millions of dollars are routinely built on single-line demand projections that imply a certainty no forecaster can honestly claim. The question is not whether the forecast will be wrong — it will be — but how wrong, in which direction, and what that means for infrastructure that takes a decade to plan, fund, and build. Probabilistic forecasting offers a fundamentally different approach: instead of a single number, it delivers a distribution of plausible outcomes, each with an associated likelihood. This opinion piece applies that approach to the international traffic at Washington Dulles International Airport (IAD), one of the fastest-growing international gateways in the United States.
Washington Dulles Case Study
IAD’s new use and lease agreement includes a $9.0B capital program for a 15-year period. That’s not chump change for an anticipated 13 million annual passenger growth from now. What if the growth doesn’t materialize?
IAD has been in the news lately – US Department of Transportation (DOT) had issued a Request for Information (RFI) seeking design, financing and construction concepts ideas for rebuilding IAD. The responses that came in ranged from some practical ideas to pure marketing sells.
During the RFI stage, an earlier opinion piece by Avinia Labs on the Airport P3 Investment Decision Framework in the context of IAD was published, which presented a single line demand total passenger forecast and highlighted the high market share concentration.
United Airlines dominance at IAD carries both advantages and risks. Their wide-ranging international exposure adds risk for the growth of international traffic – a key component of the overall aviation traffic growth anticipated at the airport. A Herfindahl-Hirschman Index of 3,900 represents a highly concentrated market, tying the success of the airport closely to the success of UA’s operation at IAD.
The Historical Record: A Story of Disruption and Recovery
IAD’s international passenger trajectory over the past decade illustrates precisely why rigid point forecasts fail and why the airport’s current position demands closer attention than a simple recovery story would suggest.
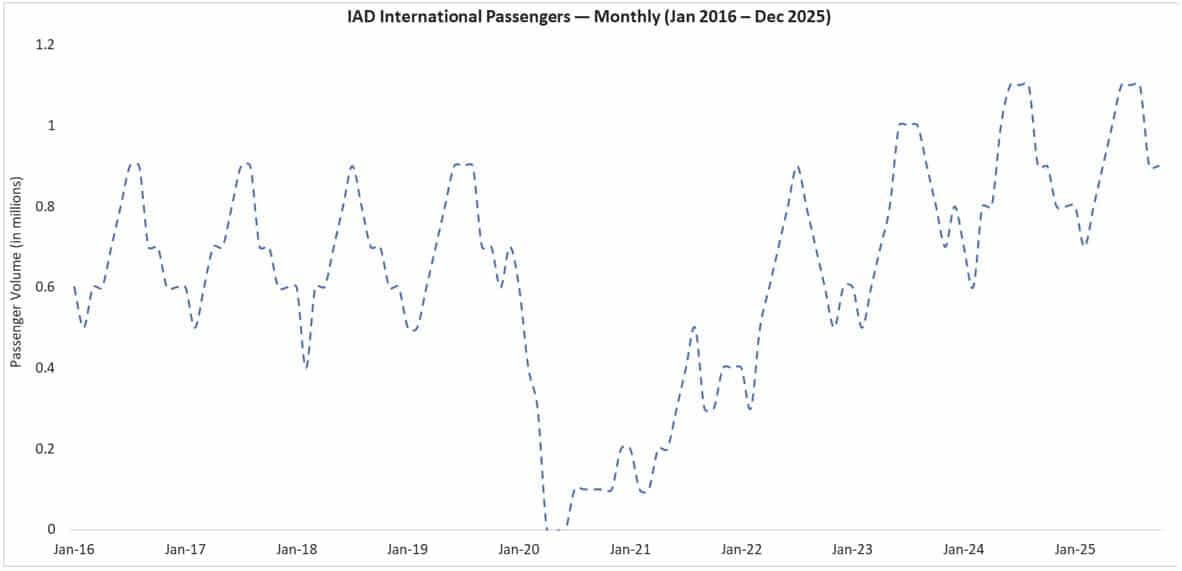
Before COVID-19, international traffic at IAD was relatively stable, hovering between 8.0–8.5 million passengers from 2016 to 2019 with modest annual growth below 1.5%. Growth was incremental, driven primarily by gradual expansion in long-haul connectivity to Europe and the Middle East rather than structural network transformation.
The pandemic caused a severe contraction in 2020, with international passengers falling by over 76% to roughly 2 million. Recovery began in 2021 and accelerated sharply in 2022 as travel restrictions lifted. By 2023, IAD had surpassed its pre-pandemic peak, reaching 9.35 million passengers. Growth continued in 2024 (10.38 million) and 2025 (10.53 million), marking three consecutive record years. Monthly peaks now exceed 1.1 million passengers — 22% higher than the 2019 high.
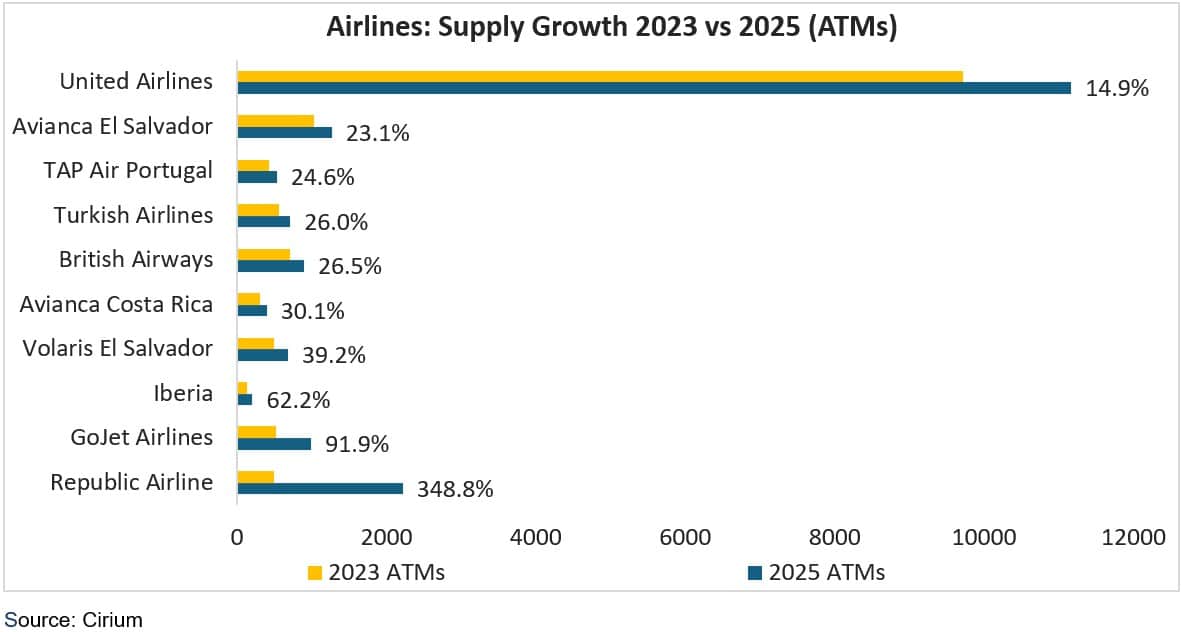
Unlike the pre-COVID plateau, the recent expansion reflects structural network broadening rather than incremental frequency additions. Total annual international flights rose 12% between 2023 and 2025. Growth has been driven by new airline entrants and new destinations across Europe, Latin America, Africa, and Asia, including significant capacity additions and aircraft upgauging (e.g., A380 deployment).
While post-2020 compound growth (~39%) is inflated by the recovery base effect, even measured from 2019 levels, international traffic is growing at approximately 3.8% annually — outperforming the long-term U.S. international average of 2–3%.
United Airlines, as the dominant home carrier operating 68% of flights at IAD, underpins the entire network, up 15% over two years. Its regional partners Republic Airline and GoJet nearly tripled their international feed operations from 494 to over 2,200 flights, reflecting United’s strategic push to broaden international connectivity through its IAD hub. The airport is not simply recovering; it is consolidating its position as a connecting hub for international traffic originating from secondary US markets – a structural shift with meaningful implications for how the forecast range should be interpreted.
Monthly Seasonality: Understanding the Peaks
International passenger traffic at IAD follows a pronounced seasonal pattern that is critical for capacity planning, staffing, and terminal design. The peak travel season runs from June through August, driven by summer leisure demand, diaspora travel, and student movements. These peak months carry roughly 70-80% more traffic than the winter trough months of January and February, when volumes typically drop to between 600,000 and 700,000 passengers.
The peak-to-trough ratio at IAD approximately 1.7:1 to 1.8:1 for international traffic is moderately high by US gateway standards, though less extreme than leisure-dominated airports in Florida or the Caribbean. Comparing peak months across years reveals a structural upward shift: June 2024 traffic exceeded June 2023 by approximately 10%, and June 2023 itself was roughly 15% above June 2019. This is not merely recovery it is structural growth layered on top of the seasonal pattern. The shoulder months of April-May and September–October have also strengthened, partly driven by airline schedule changes and the expansion of year-round long-haul services. This broadening of the demand profile is a positive development for asset utilisation, though the summer peak remains the dominant design constraint.
Methodology: SARIMAX and Monte Carlo Simulation
For this analysis, Avinia employed a Seasonal ARIMA model with external inputs (SARIMAX) a statistical framework purpose-built for time-series data exhibiting both trend and cyclical behaviour. The SARIMAX model captures three key drivers of airport traffic: long-term structural growth in demand, predictable monthly seasonality operating on a 12-month cycle, and short-term fluctuations around the trend. An explicit trend component was included to reflect the sustained post-recovery growth trajectory observed at Dulles.
Critically, the COVID-19 period from March 2020 to December 2022 was treated as a temporary exogenous shock rather than a permanent structural change. A binary external variable was introduced to isolate the pandemic’s effect on passenger volumes, allowing the model to learn from the underlying demand dynamics without being distorted by the crisis period. This methodological choice is essential: without it, the model would interpret the pandemic collapse as indicative of the system’s normal volatility, producing forecasts that are both biased downward and unrealistically uncertain. Model parameters were selected using the Akaike Information Criterion (AIC), which balances explanatory power against model complexity the configuration with the lowest AIC value was chosen to minimise the risk of overfitting to random noise while capturing the genuine signal in the data. For forward projections beyond 2025, the COVID variable was set to zero, reflecting the empirically supported assumption that international aviation operations at Dulles have fully normalised.
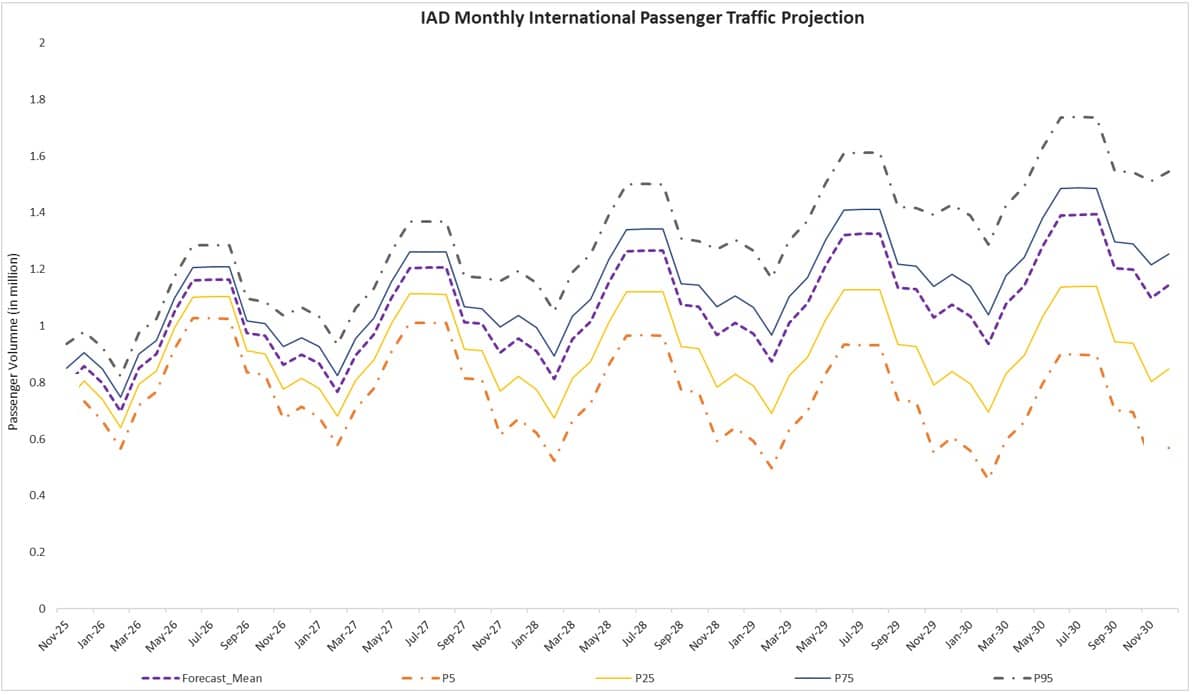
To move beyond point estimates and quantify uncertainty, Avinia conducted 1,000 Monte Carlo simulations around the SARIMAX baseline forecast. This is where the methodology departs most significantly from conventional airport forecasting practice. Rather than sampling residual volatility from the entire historical period which would include the anomalous pandemic-era variance we restricted the residual sampling window to the post-COVID recovery phase (January 2023 onwards). The pandemic represented a one-time exogenous shock that fundamentally differed from the normal operating environment; including its variance in forward projections would systematically overstate uncertainty and produce unrealistically wide confidence bands that obscure rather than inform decision-making. From the 1,000 simulated demand paths, we constructed confidence intervals at multiple percentile levels and derived a confidence range using the 5th to 95th percentiles, providing a realistic envelope of possible outcomes.
Projections to 2030: Multiple Scenarios
For planning purposes, three scenarios drawn from the Monte Carlo distribution are most informative: the P25 scenario (excluding % of simulations that generated lower demand or the top 75th percentile), representing a conservative downside case that is exceeded 75% of the time; the Average scenario, representing the central tendency of all 1,000 simulations; and the P75 scenario (75th percentile), representing an optimistic case exceeded only 25% of the time. The spread between P25 and P75 defines the interquartile range the corridor within which international passenger traffic is most likely to fall under normalised conditions.
Under the P25 (conservative) scenario, international passenger traffic grows at a compound rate of approximately 2.0-2.5% per annum from the 2025 base of 10.53 million, reaching approximately 11.9 million by 2030. This scenario reflects a world in which global economic headwinds, geopolitical disruption, or airline capacity constraints dampen the current growth trajectory a plausible outcome, but one that implies a significant deceleration from recent trends.
Under the P50 scenario, the compound annual growth rate holds at approximately 3.5-4.0%, consistent with the post-recovery structural trend and broadly aligned with IATA’s medium-term global international traffic growth forecasts. This path delivers approximately 12.8 million international passengers by 2030, representing a further 22% increase over 2025 levels. The P50 scenario implies that IAD continues to benefit from network expansion, widebody fleet upgrades including the new Concourse E development tailored for United Airlines’ international operations and sustained demand growth on the transatlantic and transpacific corridors.
Under the P75 (optimistic) scenario, growth accelerates to approximately 5.5-6.0% per annum, driven by aggressive airline capacity deployment, favourable economic conditions, and the successful capture of connecting traffic from competing East Coast gateways. This path reaches approximately 14.2 million international passengers by 2030 a figure that would position Dulles firmly among the top five US international gateways by volume. The P75 scenario is not unrealistic given recent growth rates, but it assumes that the structural tailwinds observed since 2023 —new airline entrants, route expansion, and widebody up gauging[1] — continue without significant reversal. The full 90% confidence interval (bounded by the 5th and 95th percentiles) ranges from approximately 11.0 million to 15.5 million by 2030, providing the complete envelope of plausible outcomes for long-range planning.
Implications for Infrastructure Planning
The spread between the P25 and P75 scenarios in 2030 approximately 2.3 million passengers is not a rounding error. It represents the difference between a terminal that operates comfortably within design capacity and one that requires immediate expansion. For Dulles, where the new 435,000-square-foot, 14-gate Concourse E is being designed against demand projections that will define its utility for the next 20-30 years, the choice of planning scenario has direct capital consequences. Designing to the P25 case risks early-onset congestion if growth follows the average or optimistic path. Designing to P75 risks overbuilding and stranded capital if growth moderates.
Probabilistic forecasting does not eliminate this tension; it makes it explicit. Decision-makers can see the full range of outcomes, assess the cost of being wrong in each direction, and design modular infrastructure that can be expanded incrementally as demand materialises. The Monte Carlo approach also enables scenario testing: what happens if a major airline reduces service? What if a new long-haul entrant adds significant capacity? These questions can be modelled as adjustments to the simulation parameters rather than requiring an entirely new forecast exercise.
Avinia’s View
The Dulles case study demonstrates that probabilistic forecasting is not merely a methodological refinement it is a fundamentally different way of thinking about airport demand. The traditional approach of building to a single demand line encourages binary thinking: either the forecast is right, or it is wrong. The probabilistic approach encourages portfolio thinking: what is the range of plausible outcomes, and how do we design infrastructure that performs acceptably across that range?
For airport operators and aviation authorities evaluating capital programmes in 2026, the message is straightforward. Point forecasts are a legacy of an era when computational constraints limited what was practically achievable. Monte Carlo simulation, calibrated against well-specified time-series models like SARIMAX, is now computationally trivial and analytically superior. Any master plan or terminal design programme that relies on a single demand projection is, by definition, planning for an outcome that is almost certainly not going to materialise exactly as specified. The question for IAD and for every major US gateway managing post-pandemic growth is not what traffic will be in 2030. It is what is the probability distribution of traffic in 2030, and have we designed our infrastructure to be resilient across that distribution.