Master plans, capital programmes, and terminal sizing decisions worth hundreds of millions of dollars are routinely built on single-line demand projections.
The question is not whether the forecast will be inaccurate — it will be — but how much, and in which direction, and what that means for infrastructure that takes a decade to plan, fund, and build. Probabilistic forecasting offers a fundamentally different approach: instead of a single number, it delivers a distribution of plausible outcomes, each with an associated likelihood. This opinion piece applies that approach to paint a range of scenarios for both domestic and international passenger traffic at Hyderabad International Airport (HYD), one of the fastest-growing southern aviation hubs in India.
Hyderabad International Airport Case Study
Domestic traffic has quadrupled in a decade; international connectivity has expanded to 26 scheduled destinations with total passenger traffic volumes exceeding 29 million in FY 2025.
There is a Master Plan update underway that charts the next phase of growth at Hyderabad airport and will make key decisions on the delivery timeline of big-ticket items such as a North Code F Runway, new Passenger Terminal and associated landside facilities. A total capital expenditure outlay of over INR 14,000 crore ($1.5 Billion) is anticipated in the next 5-7 years.
IndiGo is the dominant carrier with a market share of over 71% on the domestic side. This carries both advantages and risks. Their wide-ranging domestic exposure adds risk for the growth of local traffic – a key component of the overall aviation traffic growth anticipated at the airport. A Herfindahl-Hirschman Index of above 5000 represents a highly concentrated market, tying the success of the airport closely to the success of Indigo’s operation at HYD.
The disruptions in December 2025 due to the failure to adapt to the new FTDL norms are an example of the demand risk (albeit temporary in this case) for established monopolies. Domestic passenger traffic clocked 12.8% lower in December 2025 at HYD. On the international front, the ongoing West Asia conflict continues to impact air travel to the Gulf corridor, a segment that accounts for approximately 65% of HYD’s international seat supply.
The Historical Record: From 7 MAP to 29 MAP in a Decade
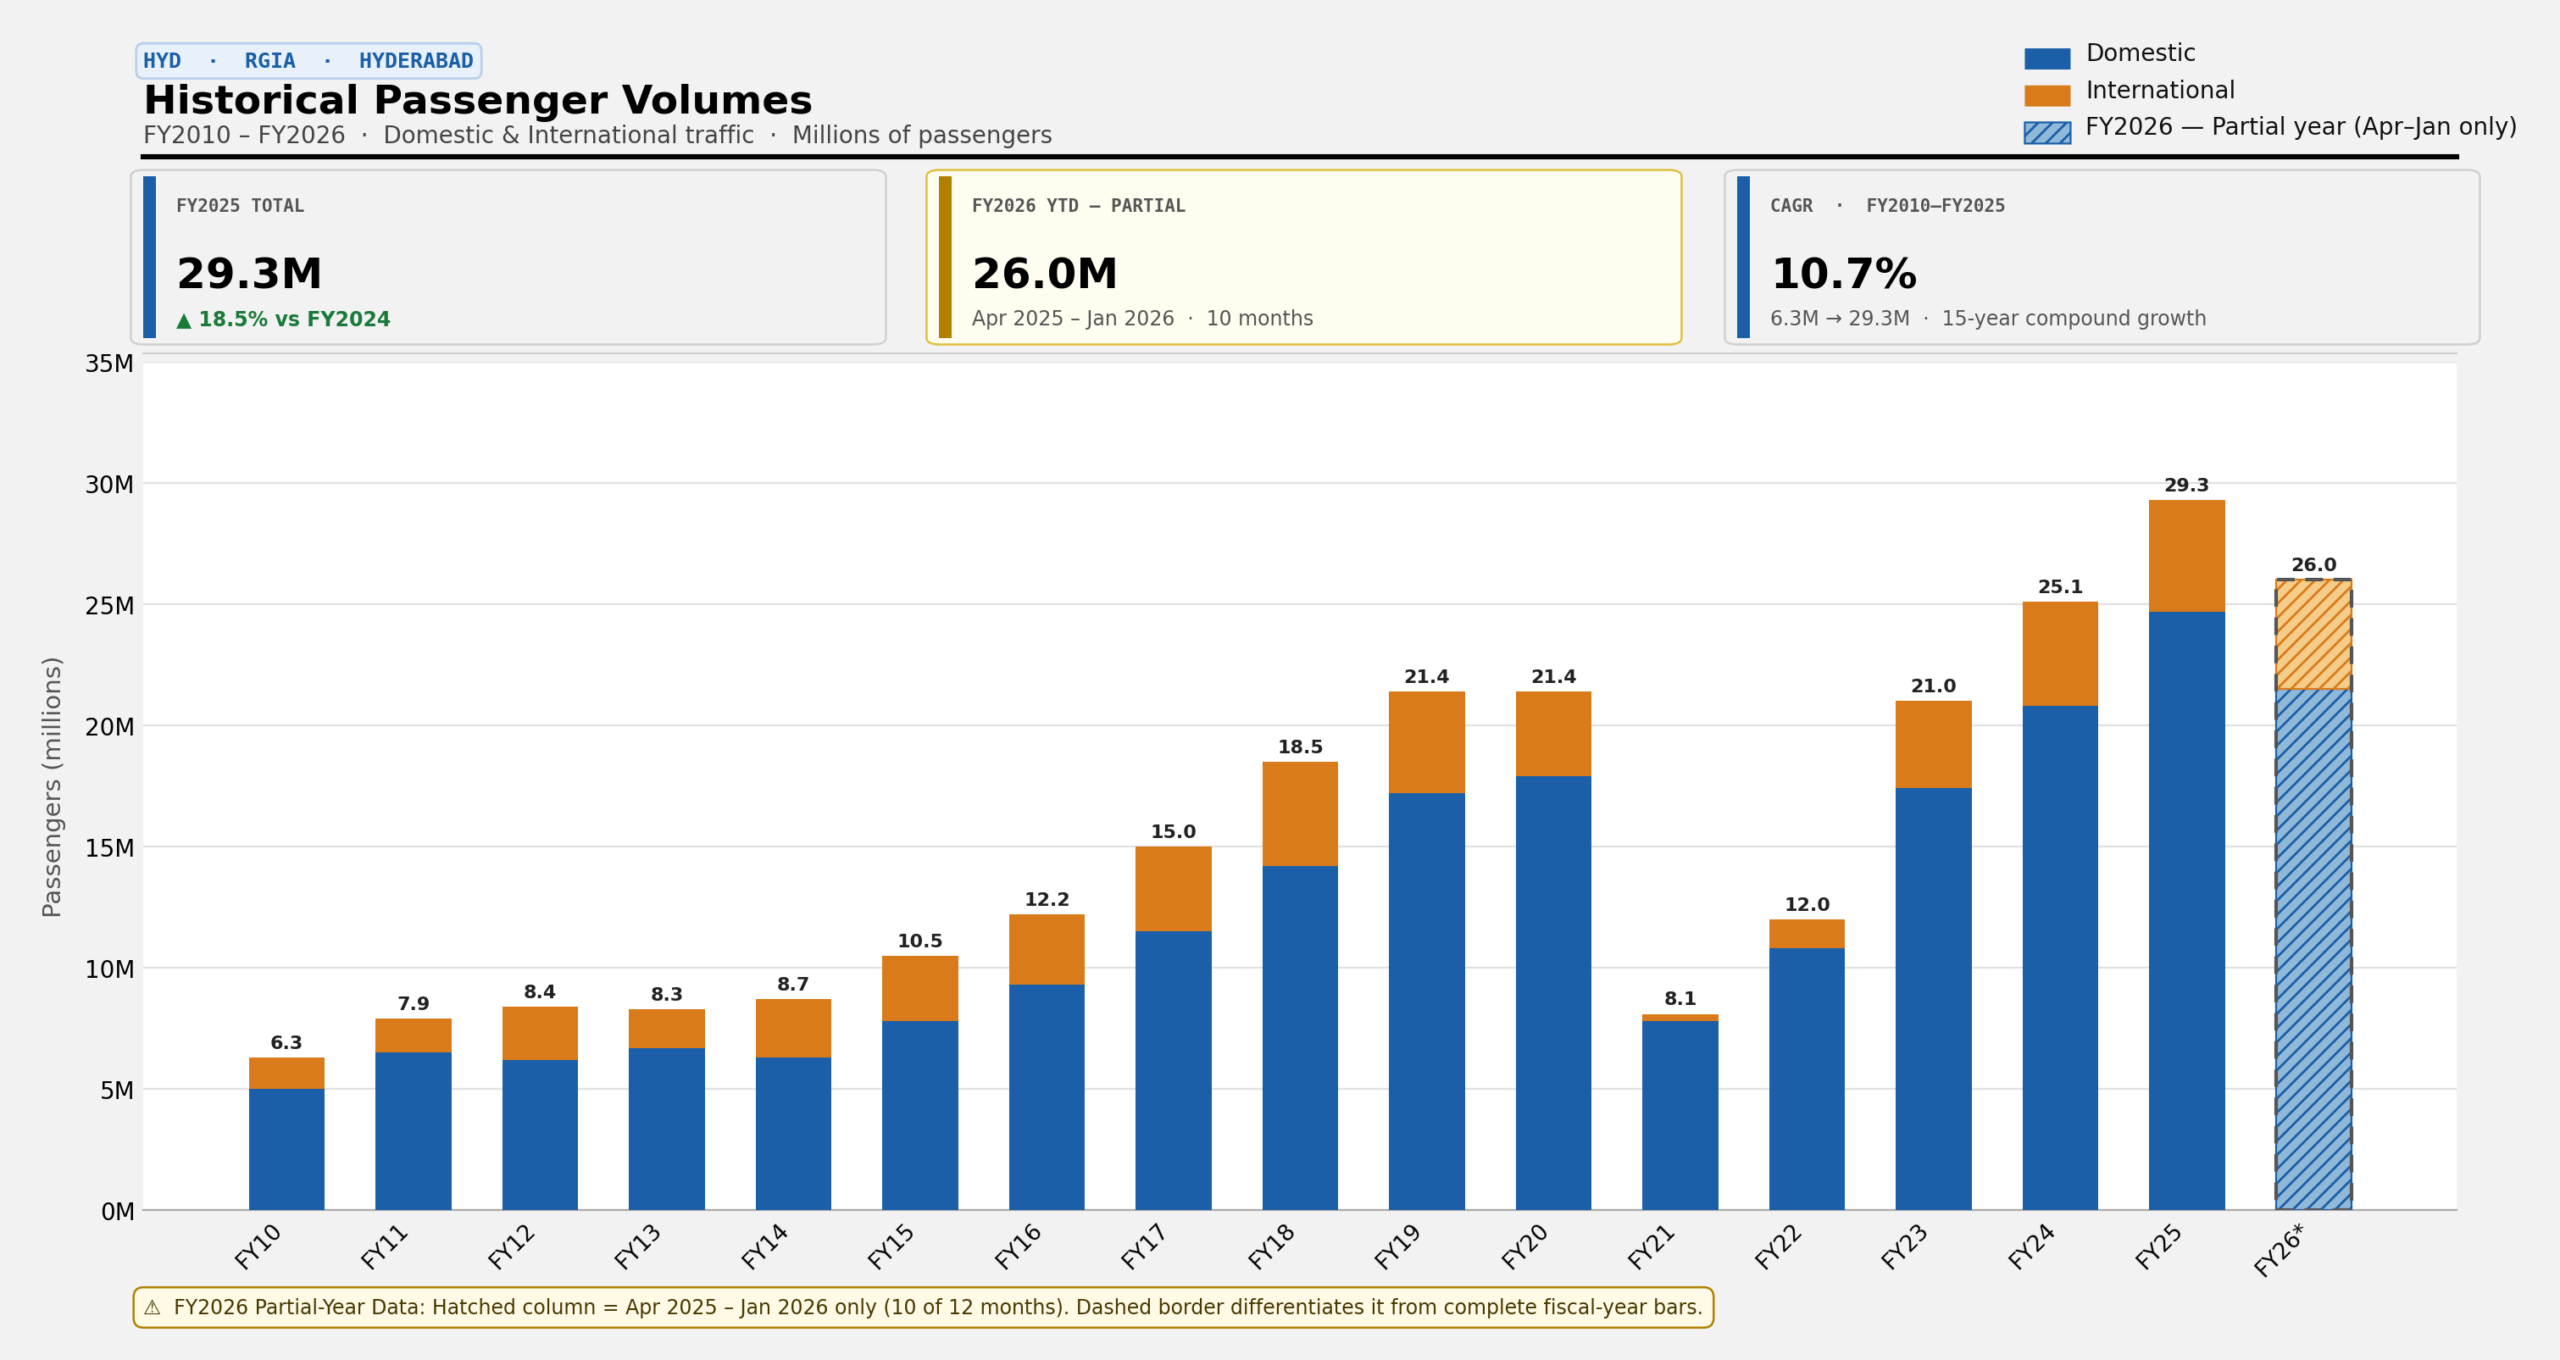
HYD’s growth story is overwhelmingly a domestic aviation story. In FY2010, the airport handled 4.8 million domestic passengers. By FY2025, traffic volumes had scaled 24.4 million, a CAGR of approximately 10.7% over 15 years. The airport grew on steroids pre-COVID period: between FY2015 and FY2019, domestic traffic grew at a CAGR of roughly 23%, propelled by IndiGo’s aggressive capacity deployment. The transfer traffic at HYD also increased significantly with IndiGo’s Domestic to Domestic hubbing strategy.
International traffic has followed a parallel but slower trajectory. From 1.9 million in FY2011, international passengers grew to 4.0 million by FY2019 (CAGR of approximately 9.2%), Recovery after COVID has been robust: Traffic volumes in FY2024 scaled 4.2 million international passengers (+23.2% YoY), and FY2025 reached a new peak of 4.7 million. The international share of total traffic remained stable at 16-18% in recent times.
 Source: AAI / Avinia Labs
Methodology: SARIMAX and Monte Carlo Simulation
An analytical framework based on a Seasonal ARIMA model with exogenous variables (SARIMAX), overlaid with 1,000-iteration Monte Carlo simulation was used to generate probabilistic confidence bands. The model was run independently for domestic and international traffic.
The COVID-19 period (March 2020–December 2022) was treated as a temporary exogenous shock using a binary variable. Model parameters were selected using the Akaike Information Criterion (AIC). Monte Carlo residuals were sampled from the post-COVID normalisation period (January 2023 onwards), ensuring that the simulated uncertainty bands reflect current operating conditions rather than pandemic-era noise.
Domestic: The IndiGo Adjustment
Since the December 2025 disruption represented a temporary exogenous shock, the data point was not utilized for the SARIMAX model to avoid any near-term downward recency bias. The temporary phenomena is evidenced in the flatlining of January 2026 volumes as compared to January 2025.
International: The Middle East Disruption Scenario
For international traffic, distinct macro-scenarios with geopolitical disruption were analyzed. The disruption scenario quantifies the impact of the West Asia conflict on HYD’s Gulf-dependent international traffic.
The modeling assumed that the disruption would continue till May 2026 and drop in volumes to the Gulf region would be confined to the ongoing month of March through May (representing 65% of total international supply from HYD). Some recovery was assumed to happen in April.
Projections to FY2030: Three Scenarios Across Two Segments
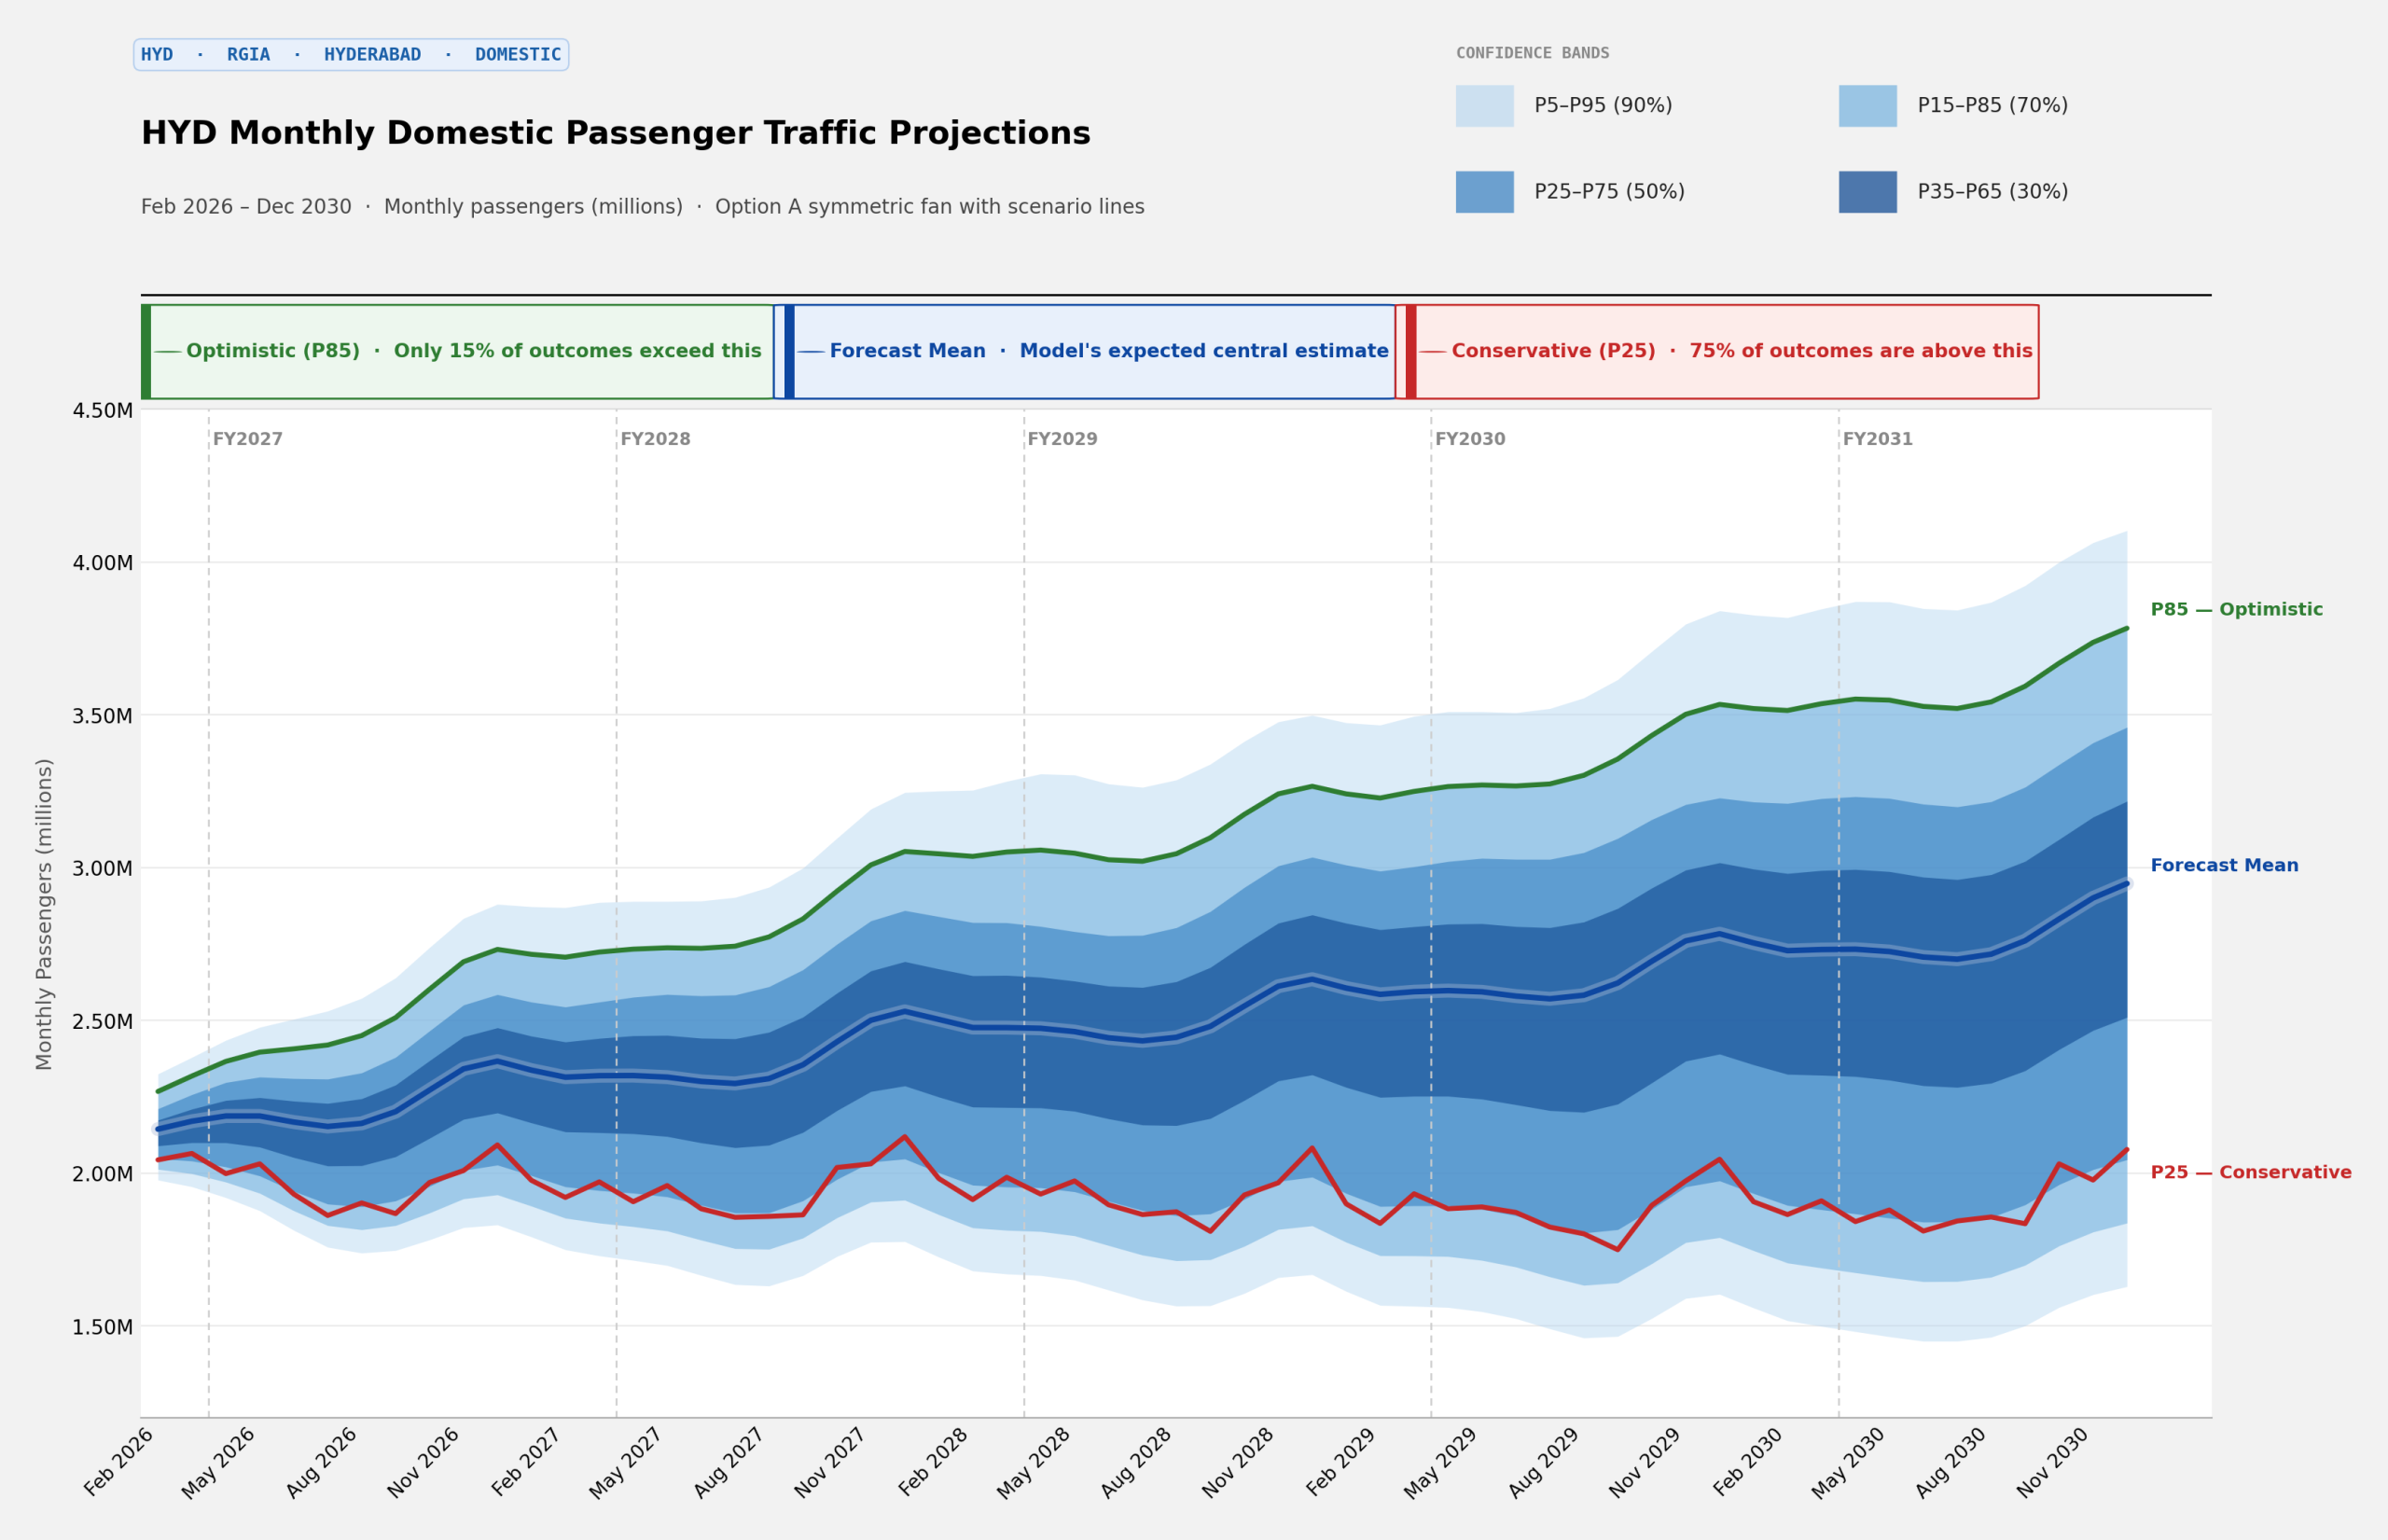
From the 1,000 Monte Carlo simulated demand paths, three scenarios drawn from the Monte Carlo distribution are most informative: P25 (conservative, exceeded 75% of the time), P50 (base case, the forecast mean), and P85 (optimistic, exceeded only 15% of the time). The P25-P85 range defines the corridor within which traffic is most likely to fall under the modelled conditions.
Domestic Traffic Projections
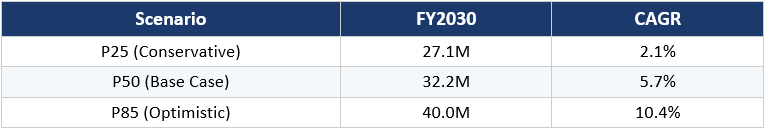
Under the P50 base case, domestic traffic grows from 24.4 million in FY2025 to approximately 32.2 million by FY2030 representing aCAGR of roughly 5.7%.
The P25 conservative path (resulting in 27.1 million passengers in FY2030) reflects a world where IndiGo’s fleet recovery is delayed, economic headwinds dampen travel demand, and competing airports absorb a larger share of southern India’s growth. The P85 optimistic scenario reaches approximately 40.0 million (CAGR of 10.4%), driven by full IndiGo fleet restoration, aggressive deployment by competitors, and GDP growth above 7%.
 Source: Avinia Labs SARIMAX-Monte Carlo model
The steep upside CAGR (10.4%) vs muted downside (2.1%) suggests:
The market is supply-constrained in the base case.
When supply is released → demand responds strongly
The spread between P25 and P85 widens dramatically over the horizon: from 5.6 million in FY2027 to 12.9 million by FY2030. A single-line forecast would entirely obscure this aspect.
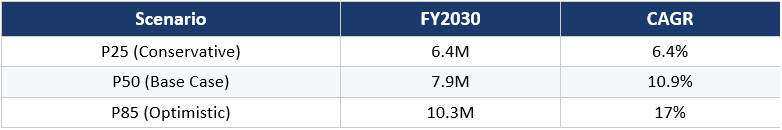
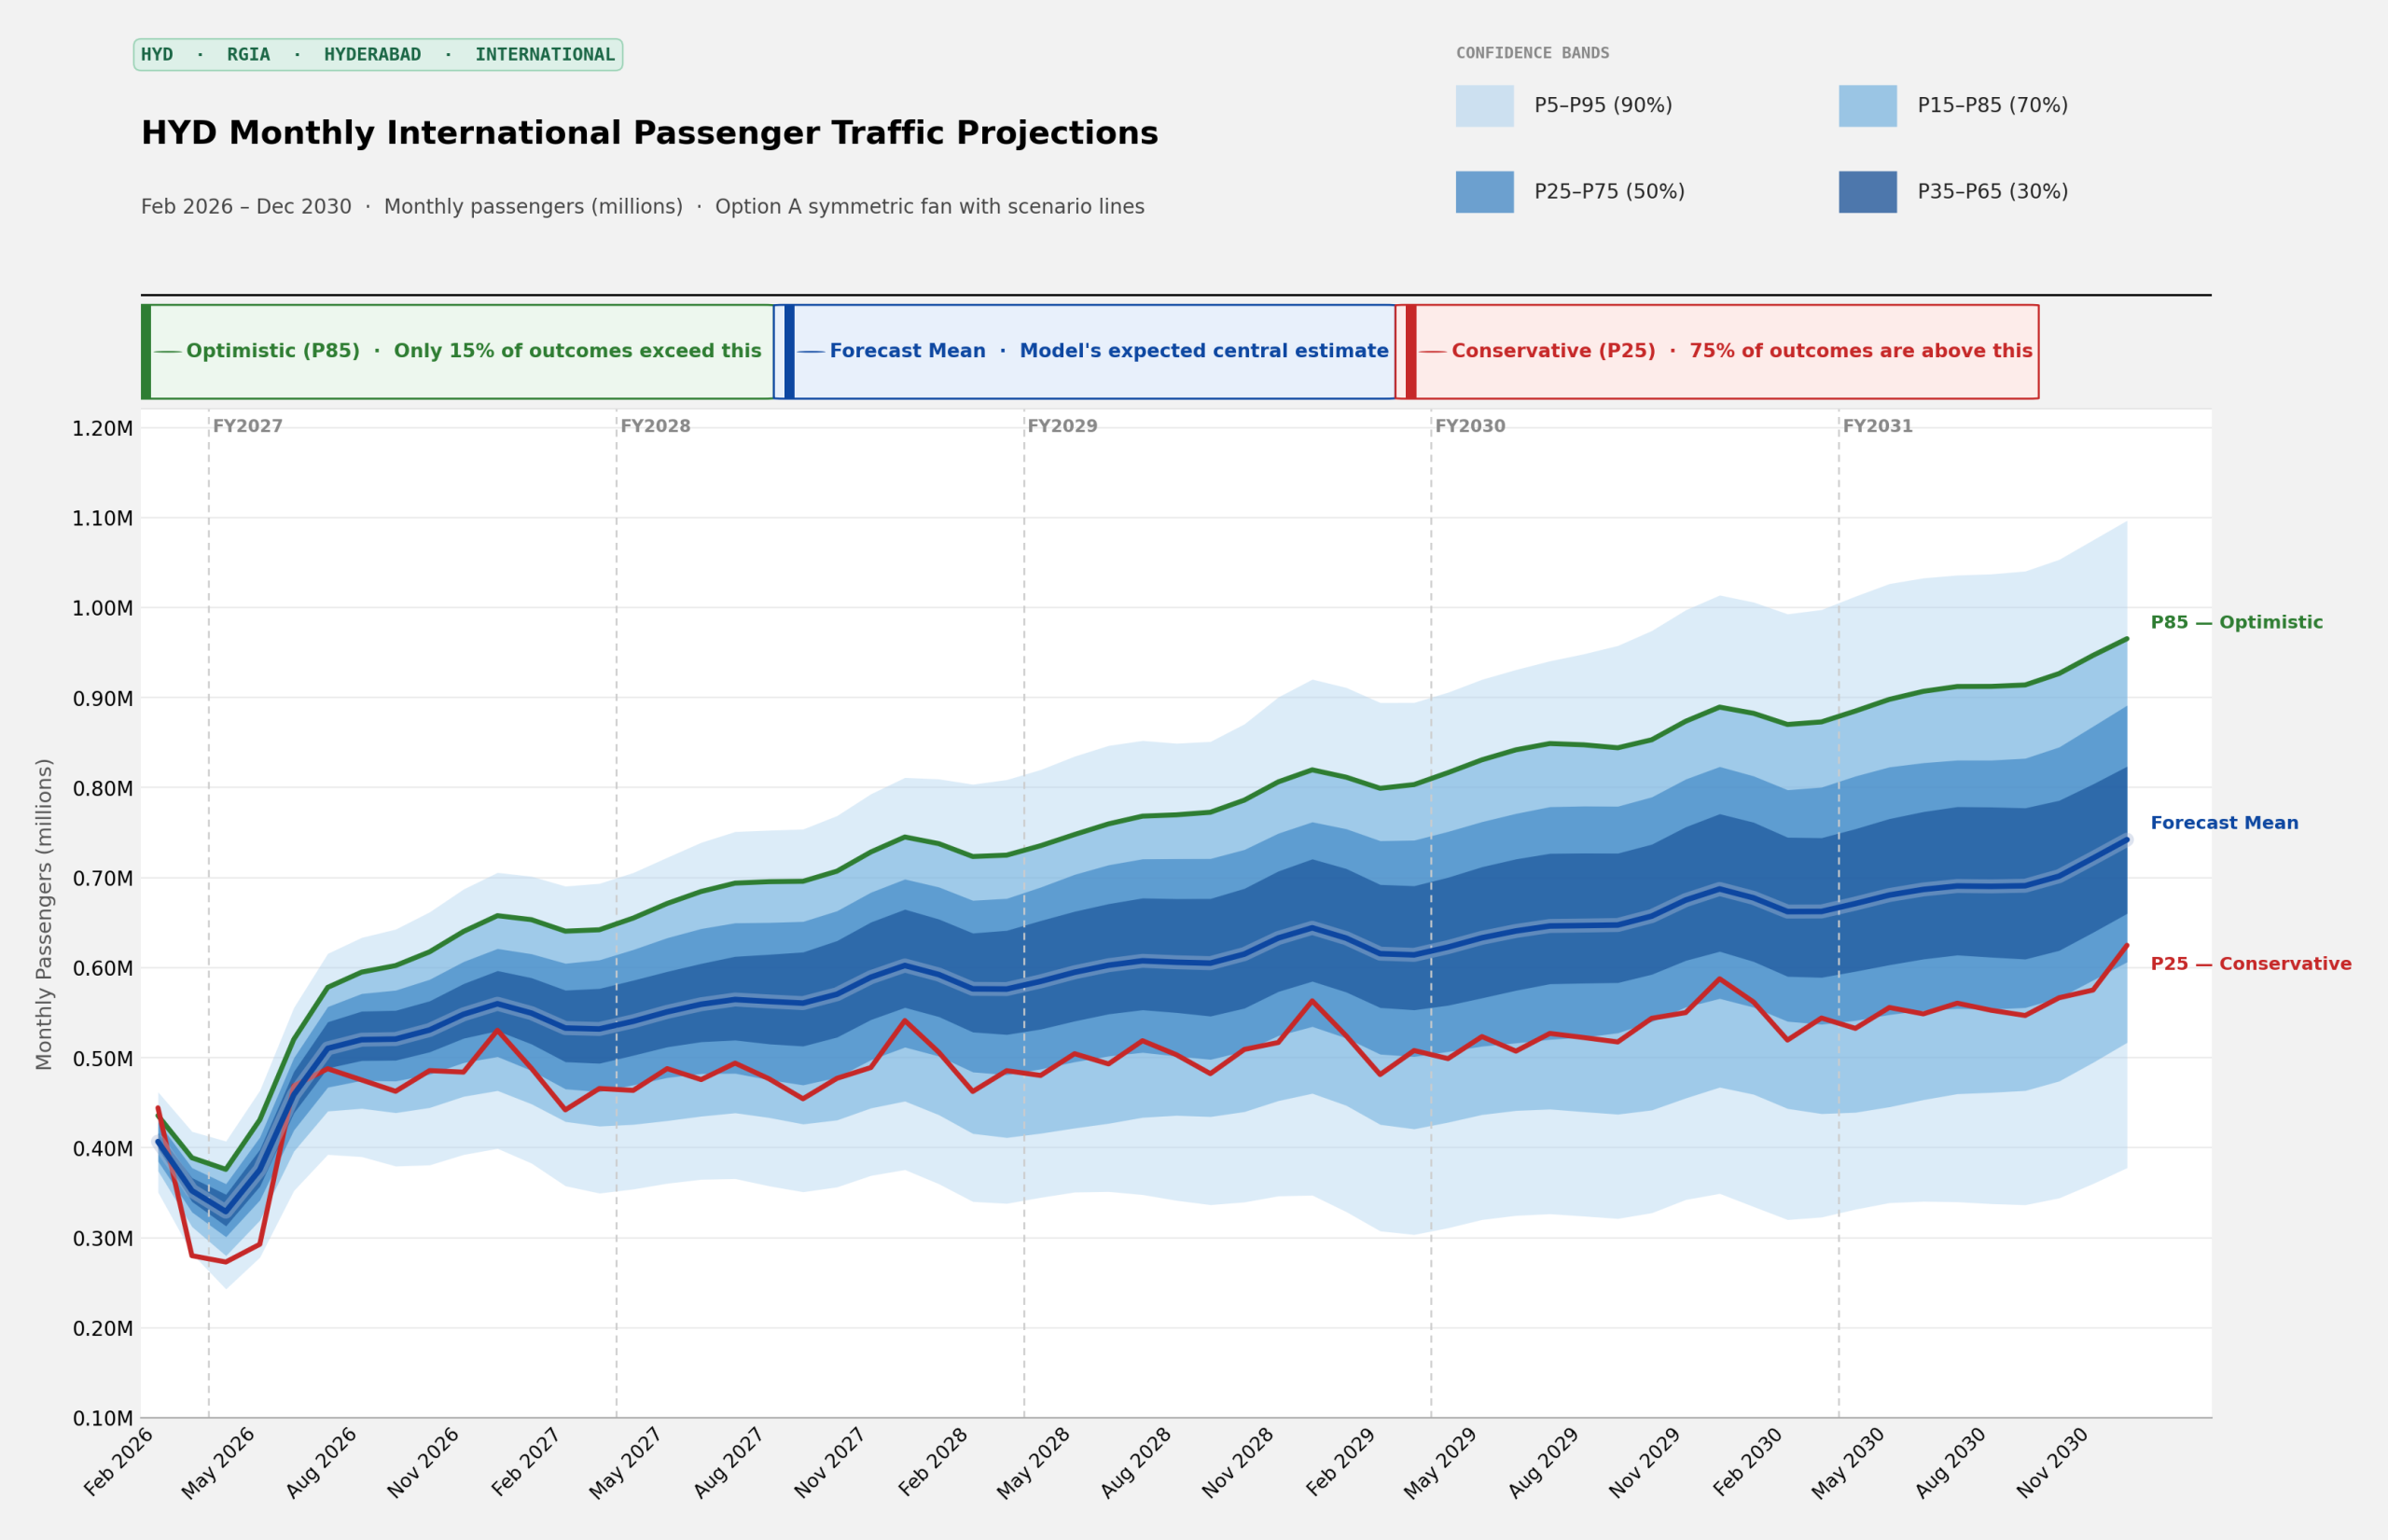
International Traffic: Geopolitical Disruption
The geopolitical disruption scenario tells a different near-term story. By removing Gulf seat supply for March-May 2026, FY2027 international traffic volumes at the P50 level are lower by 380,000 passengers than if there was no war. The impact is concentrated in the first quarter, with the Gulf corridor’s 65% share of international seats amplifying the shock.
 Source: Avinia Labs SARIMAX-Monte Carlo model
Combined Traffic: The 40-Million Passenger Question
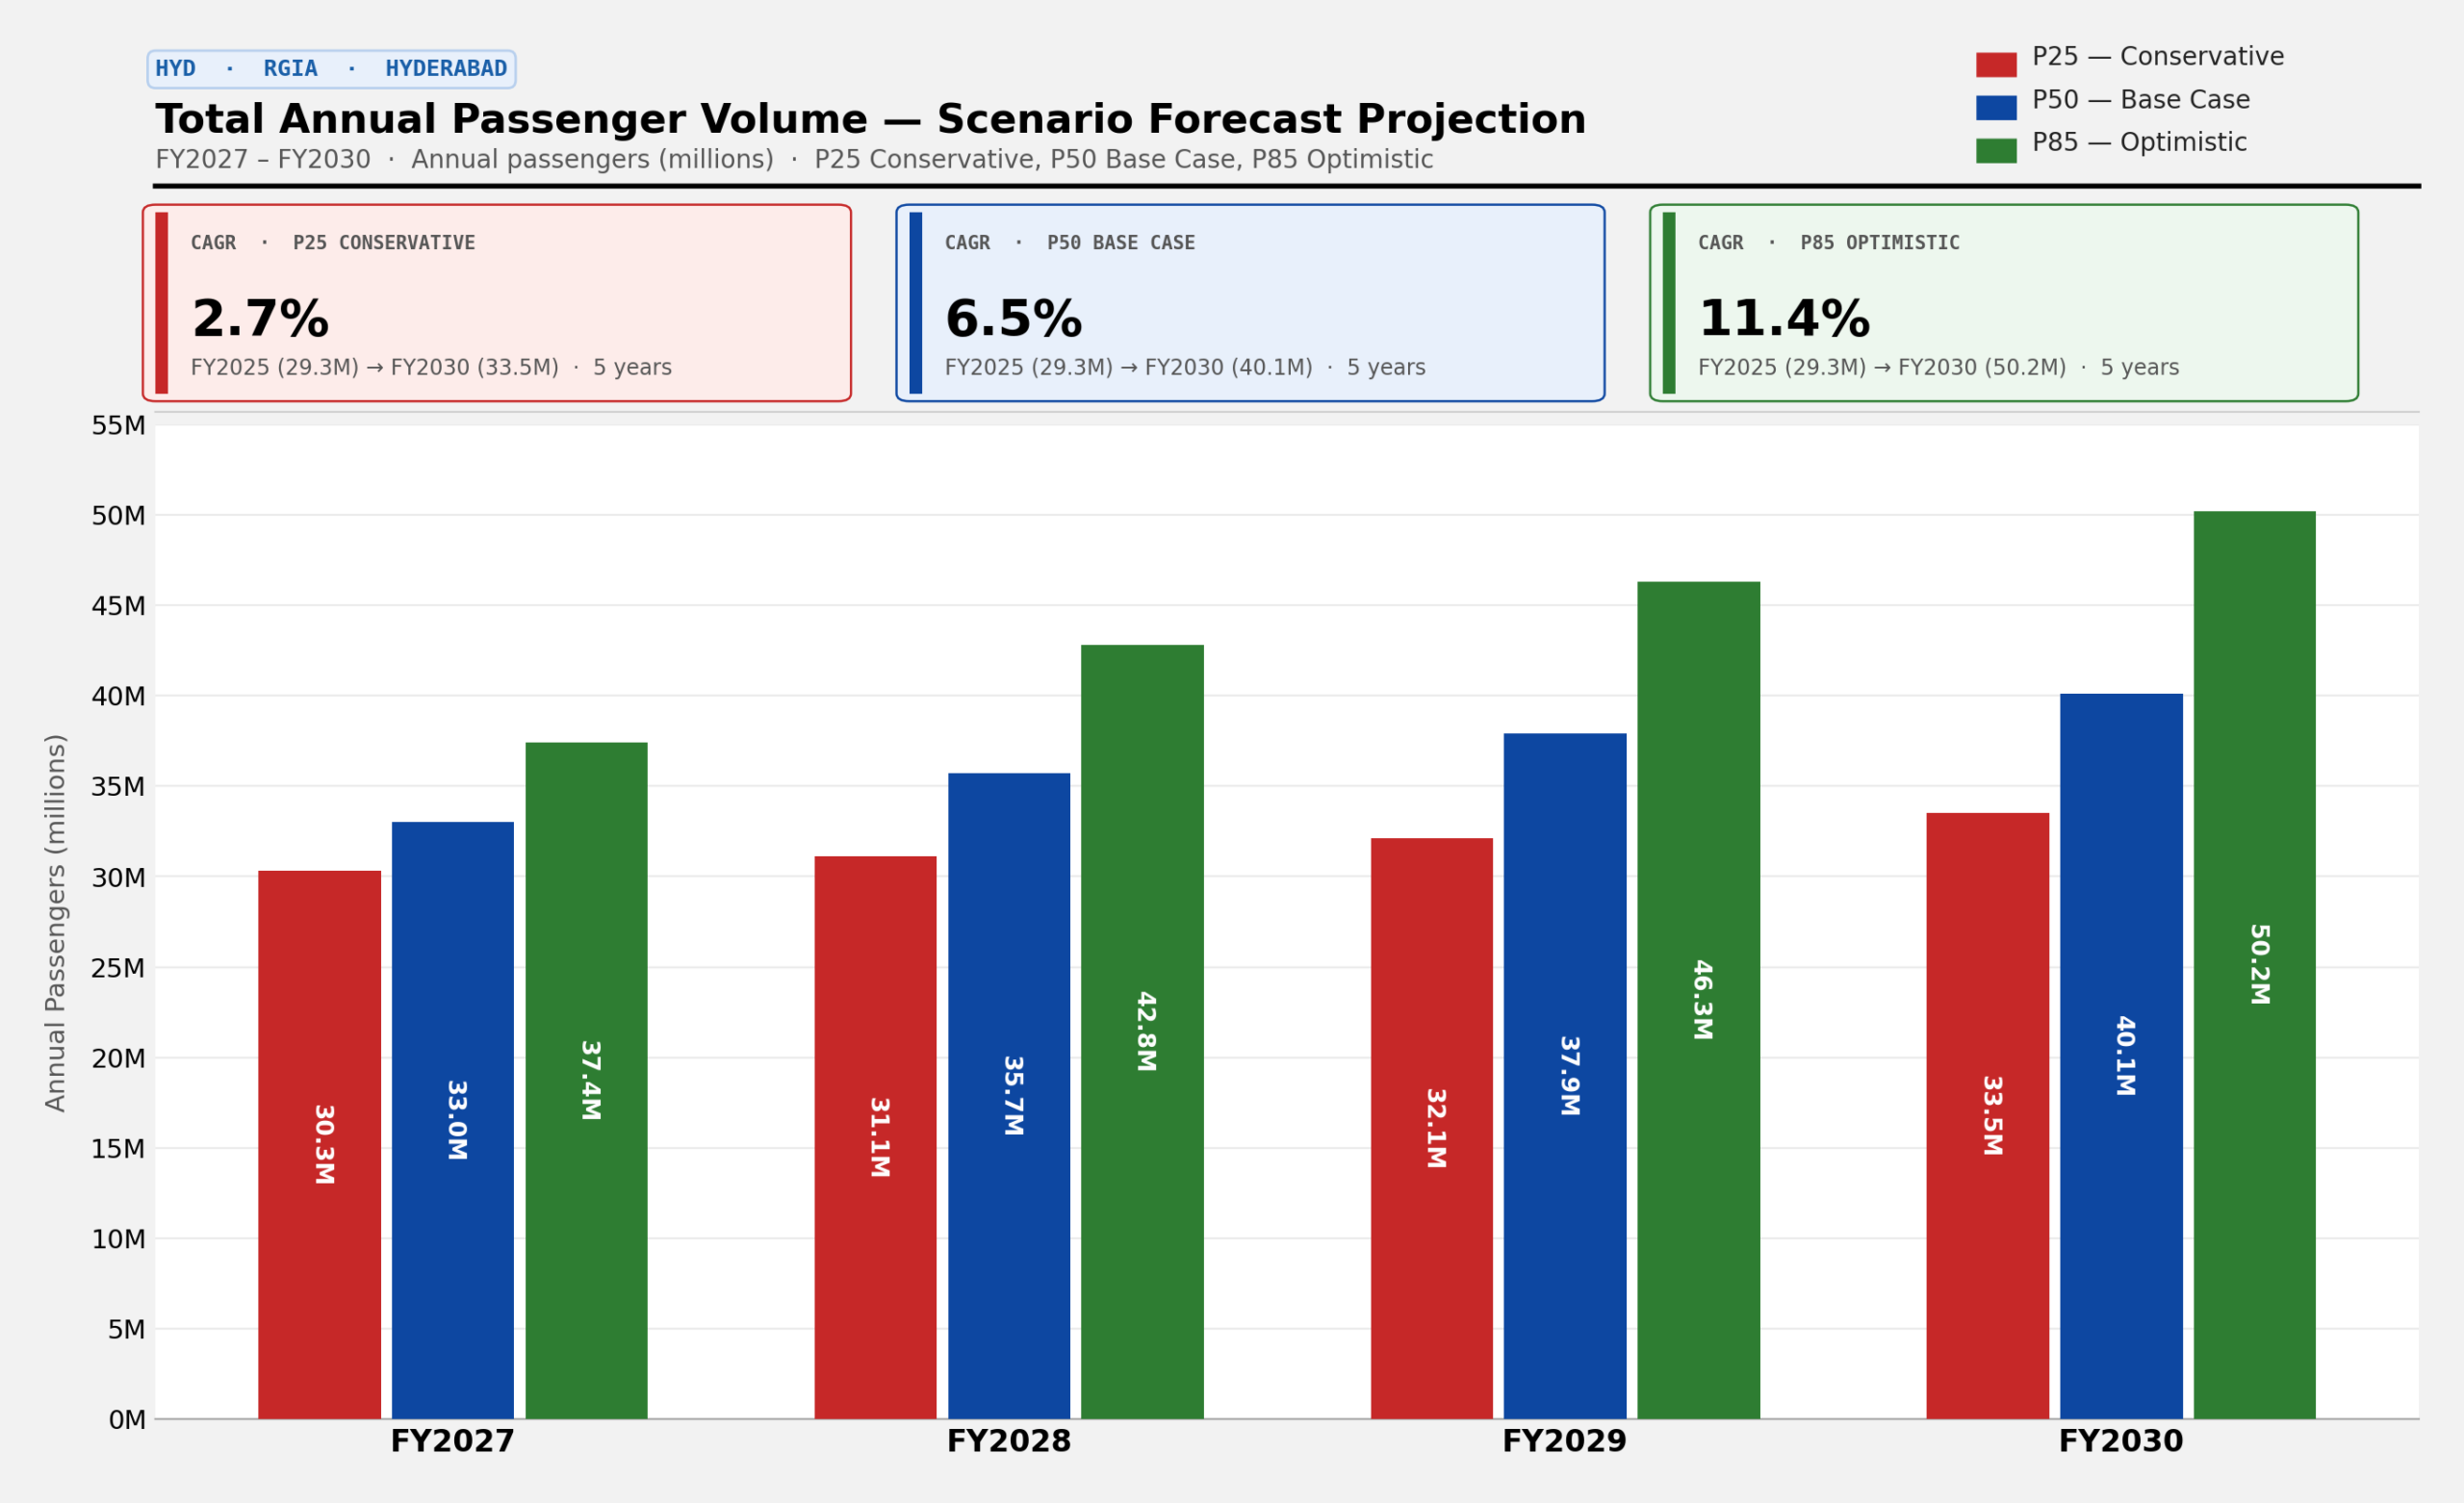 Source: Avinia Labs
That widening spread between the conservative and optimistic cases by FY2030 is a key consideration that needs to be factored into the design of new infrastructure. It is the difference between a new terminal that operates at a reasonable LOS at opening or that is congested from year 1.
Avinia’s View: Two Risks That Define the Near-Term Outlook
HYD has earned its position as one of India’s fastest-growing major airport, underpinned by strong economic fundamentals, sustained airline expansion, and a steadily strengthening international network. However, the HYD case study demonstrates that the divergence in the demand across the scenarios is driven by supply-side uncertainty, not demand alone.
The near-term outlook from the model speculates two specific and measurable risks.
First, the extreme airline concentration, IndiGo at 71% of seats, an HHI concentration exceeding 5,000, creates single-carrier dependency risk. Any operational disruption, capacity pullback, or strategic reorientation by IndiGo would have outsized impact on HYD’s domestic traffic. Second, the international network is dependent on the Middle East. Twelve Gulf destinations account for approximately 2.3 million annual seats, or 65-67% of all international supply. This is not just connectivity to the Gulf; it is connectivity through the Gulf, as Emirates, Etihad, and Qatar Airways funnel HYD traffic onto their global networks.
The short-term downside is real: reduced Gulf connectivity means fewer connecting passengers flowing through HYD to United States and Europe. However, the model assumes this disruption is time-limited. The risk worth watching is whether the conflict escalates further, extending the disruption window beyond the three months modelled.
Probabilistic forecasting is not merely a methodological refinement it is a fundamentally different way of thinking about airport demand. The traditional approach of building a single demand line encourages binary thinking: either the forecast is right, or it is wrong. The probabilistic approach encourages portfolio thinking: what is the range of plausible outcomes, and how do we design infrastructure that performs acceptably across that range?
For airport operators and aviation authorities evaluating capital programmes in 2026, the message is straightforward. Point forecasts are a legacy of an era when computational constraints limited what was practically achievable. Monte Carlo simulation, calibrated against well-specified time-series models like SARIMAX, is now computationally trivial and analytically superior. Any master plan or terminal design programme that relies on a single demand projection is, by definition, planning for an outcome that is almost certainly not going to materialise exactly as specified.
The question for HYD is not what traffic will be in 2030. What is the probability distribution of traffic in 2030, and can the new infrastructure be resilient across that distribution.