Two questions sit behind any assessment of India’s regional connectivity programme: what happened to the routes UDAN helped create? And what happened to the rest of India’s domestic network while UDAN was expanding? Single-month snapshots cannot answer either question particularly well. Regional markets are seasonal, airline schedules change quickly, and one unusually strong or weak month can distort the apparent trajectory of a route. So we aggregated monthly city-pair passenger data into fiscal years from FY2015–16 through FY2025–26, cross-referenced every route against the official list of 679 RCS-UDAN routes awarded as of July 2026, and split the network into three market frameworks: “Legacy” — the 357 city-pairs already carrying scheduled service in FY2015–16, before UDAN existed; “UDAN-Routes” — new connectivity where an operational RCS-UDAN route contributed to establishing the market; and “Non-UDAN-Routes” — new regional aviation markets that emerged without operational RCS-UDAN support.
This distinction is important because the traffic curve alone cannot tell us how a market was created. An airport can move from zero passengers to several hundred thousand passengers because subsidy helped airlines test latent demand. It can also produce exactly the same curve because pilgrimage, tourism, business activity, or another commercial driver made scheduled service viable independently. The shape is similar. The policy implication is not.
Angle One: What Happened to the UDAN-Era Routes
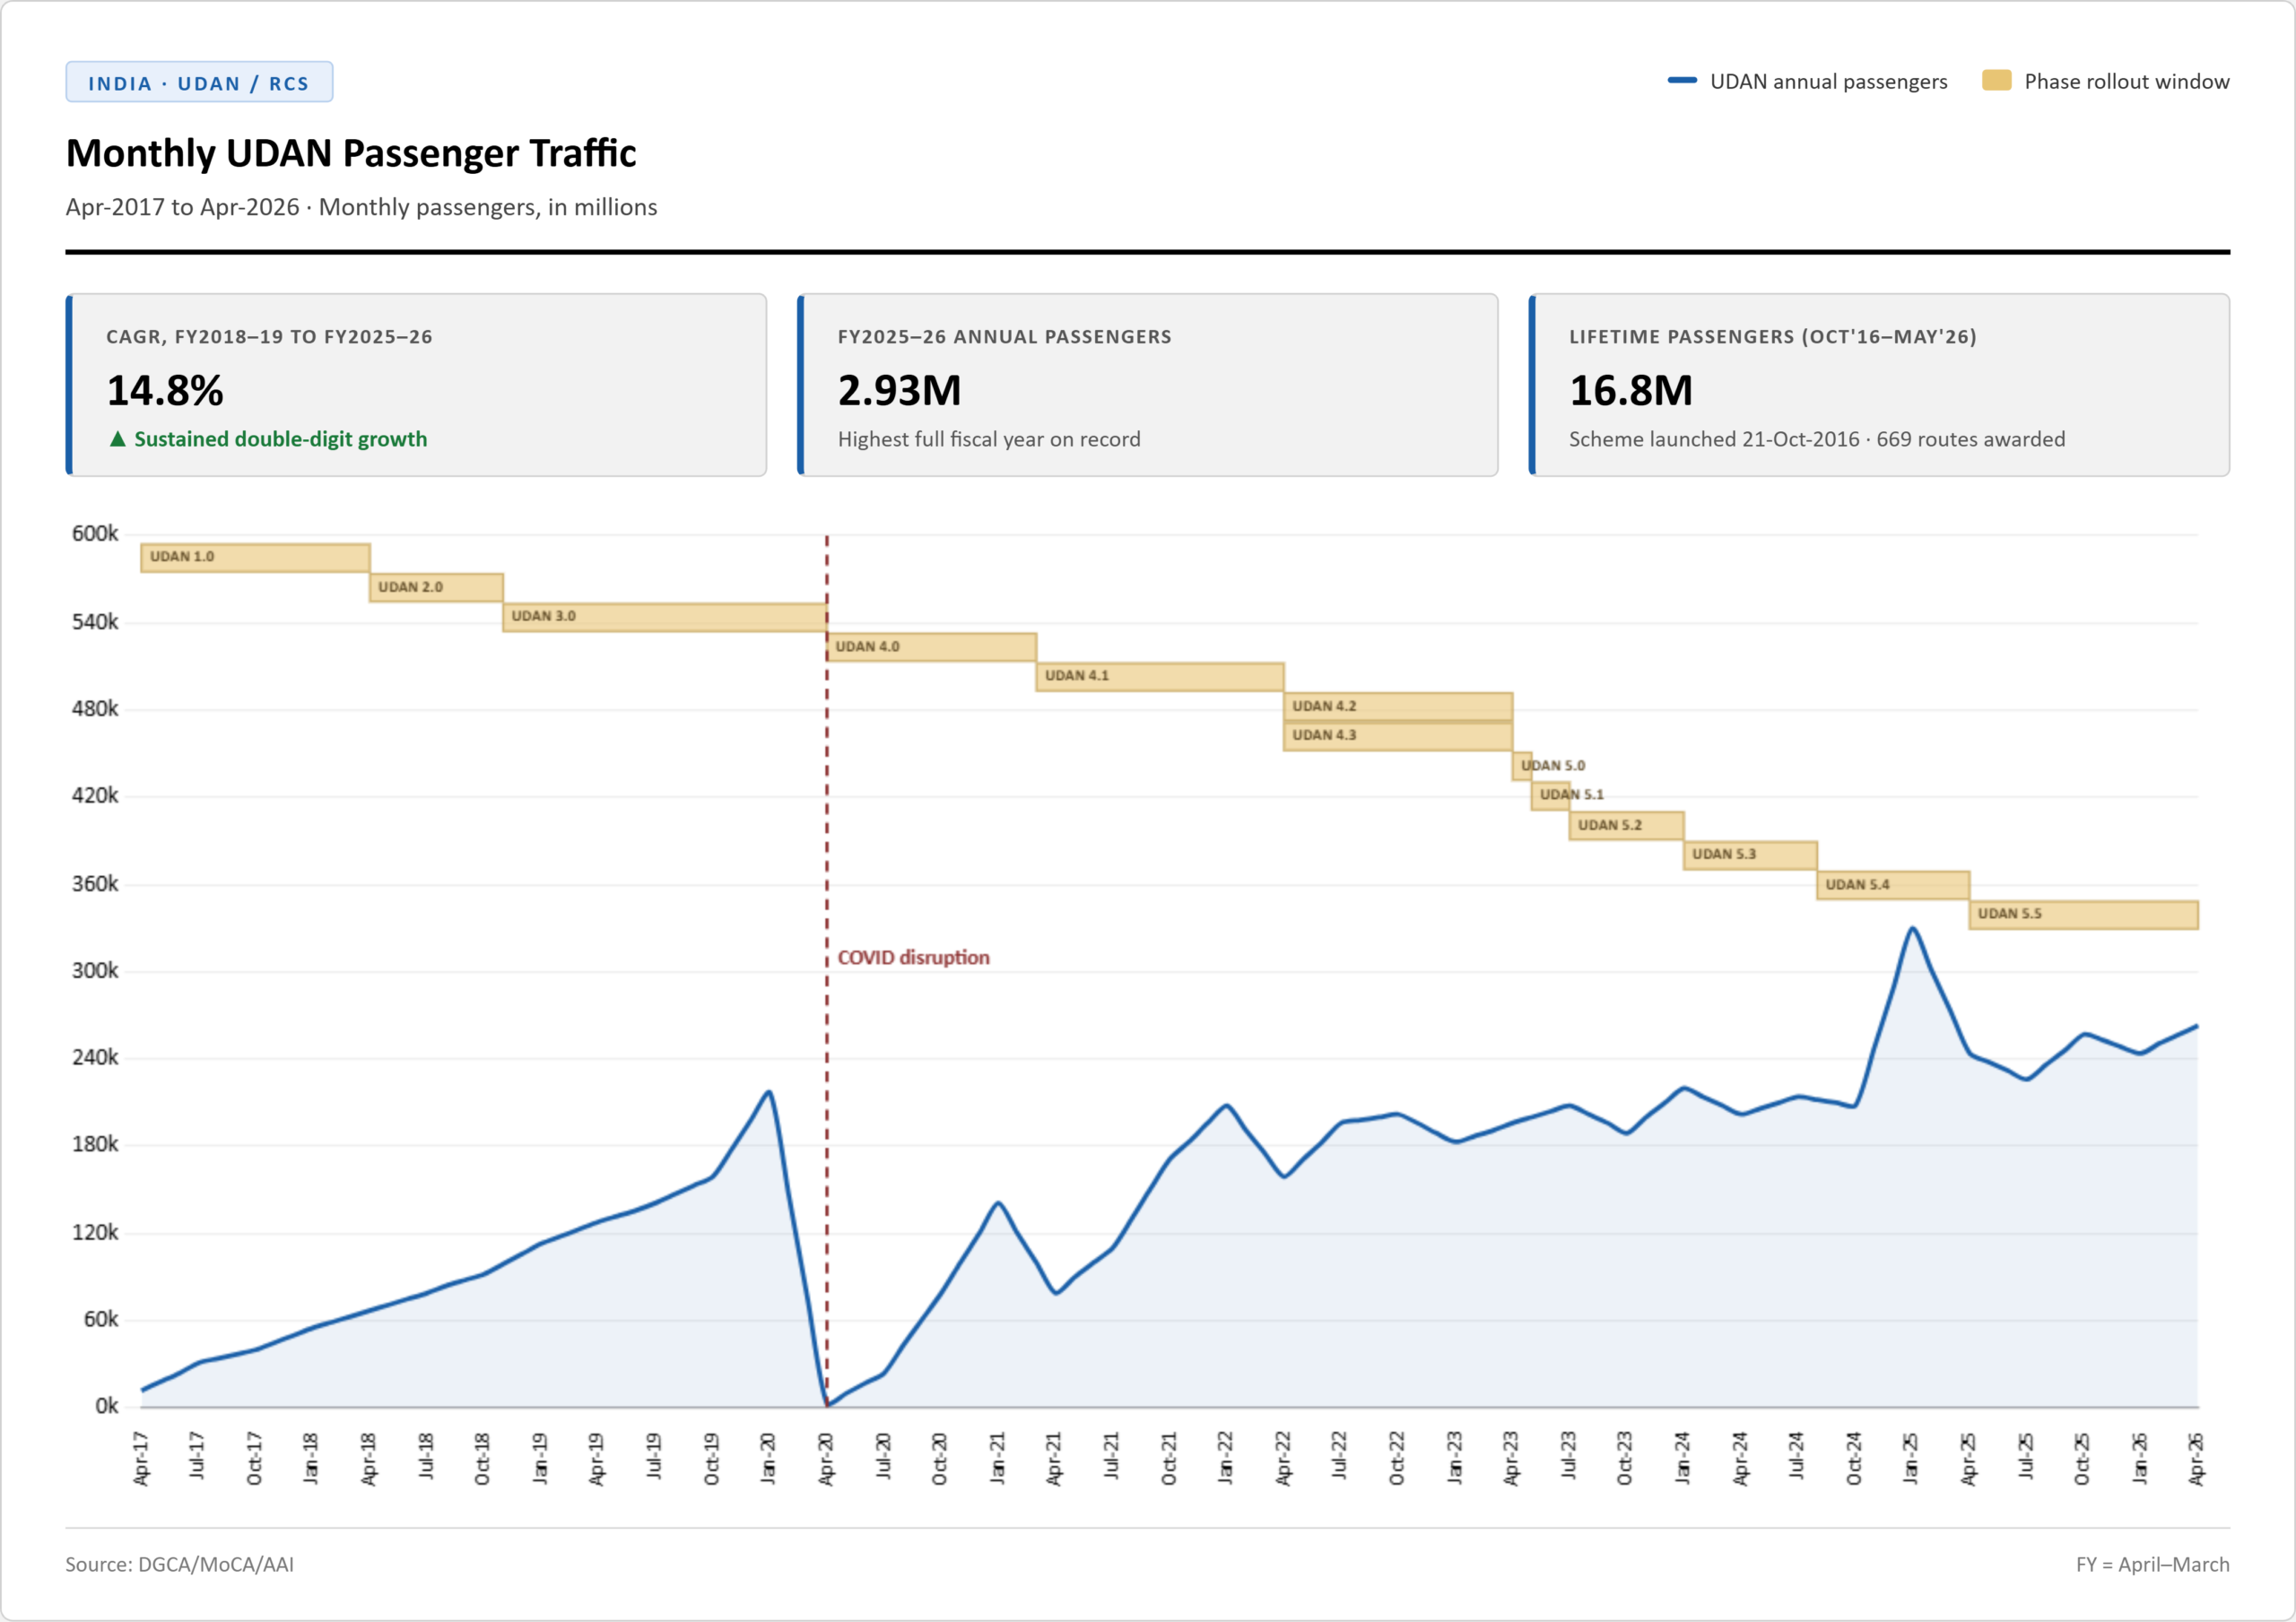
The UDAN scheme was launched in October 2016, and the first UDAN flight operated in April 2017. Traffic grew to 42 routes and 529,000 passengers in FY2017–18, the first year in which UDAN flights operated at scale. From there it grew steadily: 80 routes and 1.3 million passengers in FY2018–19, through to 136 routes and 4.12 million passengers in FY2025–26.
By FY2025–26, UDAN routes accounted for roughly one in seven active city-pairs nationally (136 of 896). The average UDAN route in FY2026 carried about 30,200 passengers a year; the average Legacy route carried 255,000 — nearly nine times as much. The route count therefore tells only part of the story. Much of the connectivity created over the past decade remains thin.
UDAN’s 15 percent route share yields a 2.5 percent passenger share of India-wide traffic in FY2025–26. Official numbers from MoCA/DGCA performance data on UDAN specifically1 (679 routes awarded, 348 unique city-pairs, 16.8 million lifetime passengers since 2017) confirms the same shape from the top down — though the total lifetime passenger figure from the bottom-up independent analysis done by Avinia Labs is 24 percent higher.
Of the 679 officially awarded RCS-UDAN routes, 227 unique city-pairs matched to the dataset; the remaining ~102 do not appear in it, likely because they run as non-scheduled service — helicopter or charter operations — outside DGCA’s scheduled reporting.
A success story of the RCS-UDAN scheme is best demonstrated by the traffic growth at Darbhanga Airport. Darbhanga had no scheduled service before FY2020–21, then went from 150,000 passengers in its first partial year to a sustained 477,000–760,000 annually for five straight years, hitting a new high of 760,000 in FY2025–26. The significance is that the airport subsequently developed a level of demand capable of supporting a much broader commercial network.
Jharsuguda and Kanpur, both confirmed official RCS routes to Delhi, show steadier but still real growth: Jharsuguda from 227,000 (FY2019–20) to 450,000 (FY2025–26), Kanpur from 139,000 to 356,000 over the same window. Both demonstrate the kind of outcome a market-discovery programme is designed to produce — support helps initiate connectivity, demand becomes visible, and the market begins acquiring commercial depth.
Pakyong provides the counterexample. Sikkim’s mountain airport, connected to Delhi under UDAN 1.0, peaked at 47,000 annual passengers in FY2021–22 and has fallen every year since, to zero in FY2025–26. Its trajectory is a useful reminder of the importance of identifying routes that are struggling to achieve sustained demand early enough to redirect resources effectively.
Prayagraj deserves a mention as well. It is an RCS route, and annual passengers grew from a pre-UDAN baseline of roughly 44,000–54,000 to a genuine plateau of 400,000–630,000 through FY2023–24 — a real, sustained 10x-plus increase, consistent with UDAN’s top Tier-2 airport by traffic. But FY2024–25 shows an outlier spike to 1.04 million passengers across 19 routes, which falls squarely in the window of the January–February 2025 Maha Kumbh Mela — one of the largest religious gatherings in the world. FY2025–26 reverted to 534,000 passengers on 10 routes.
Angle Two: What Happened to Everything Else
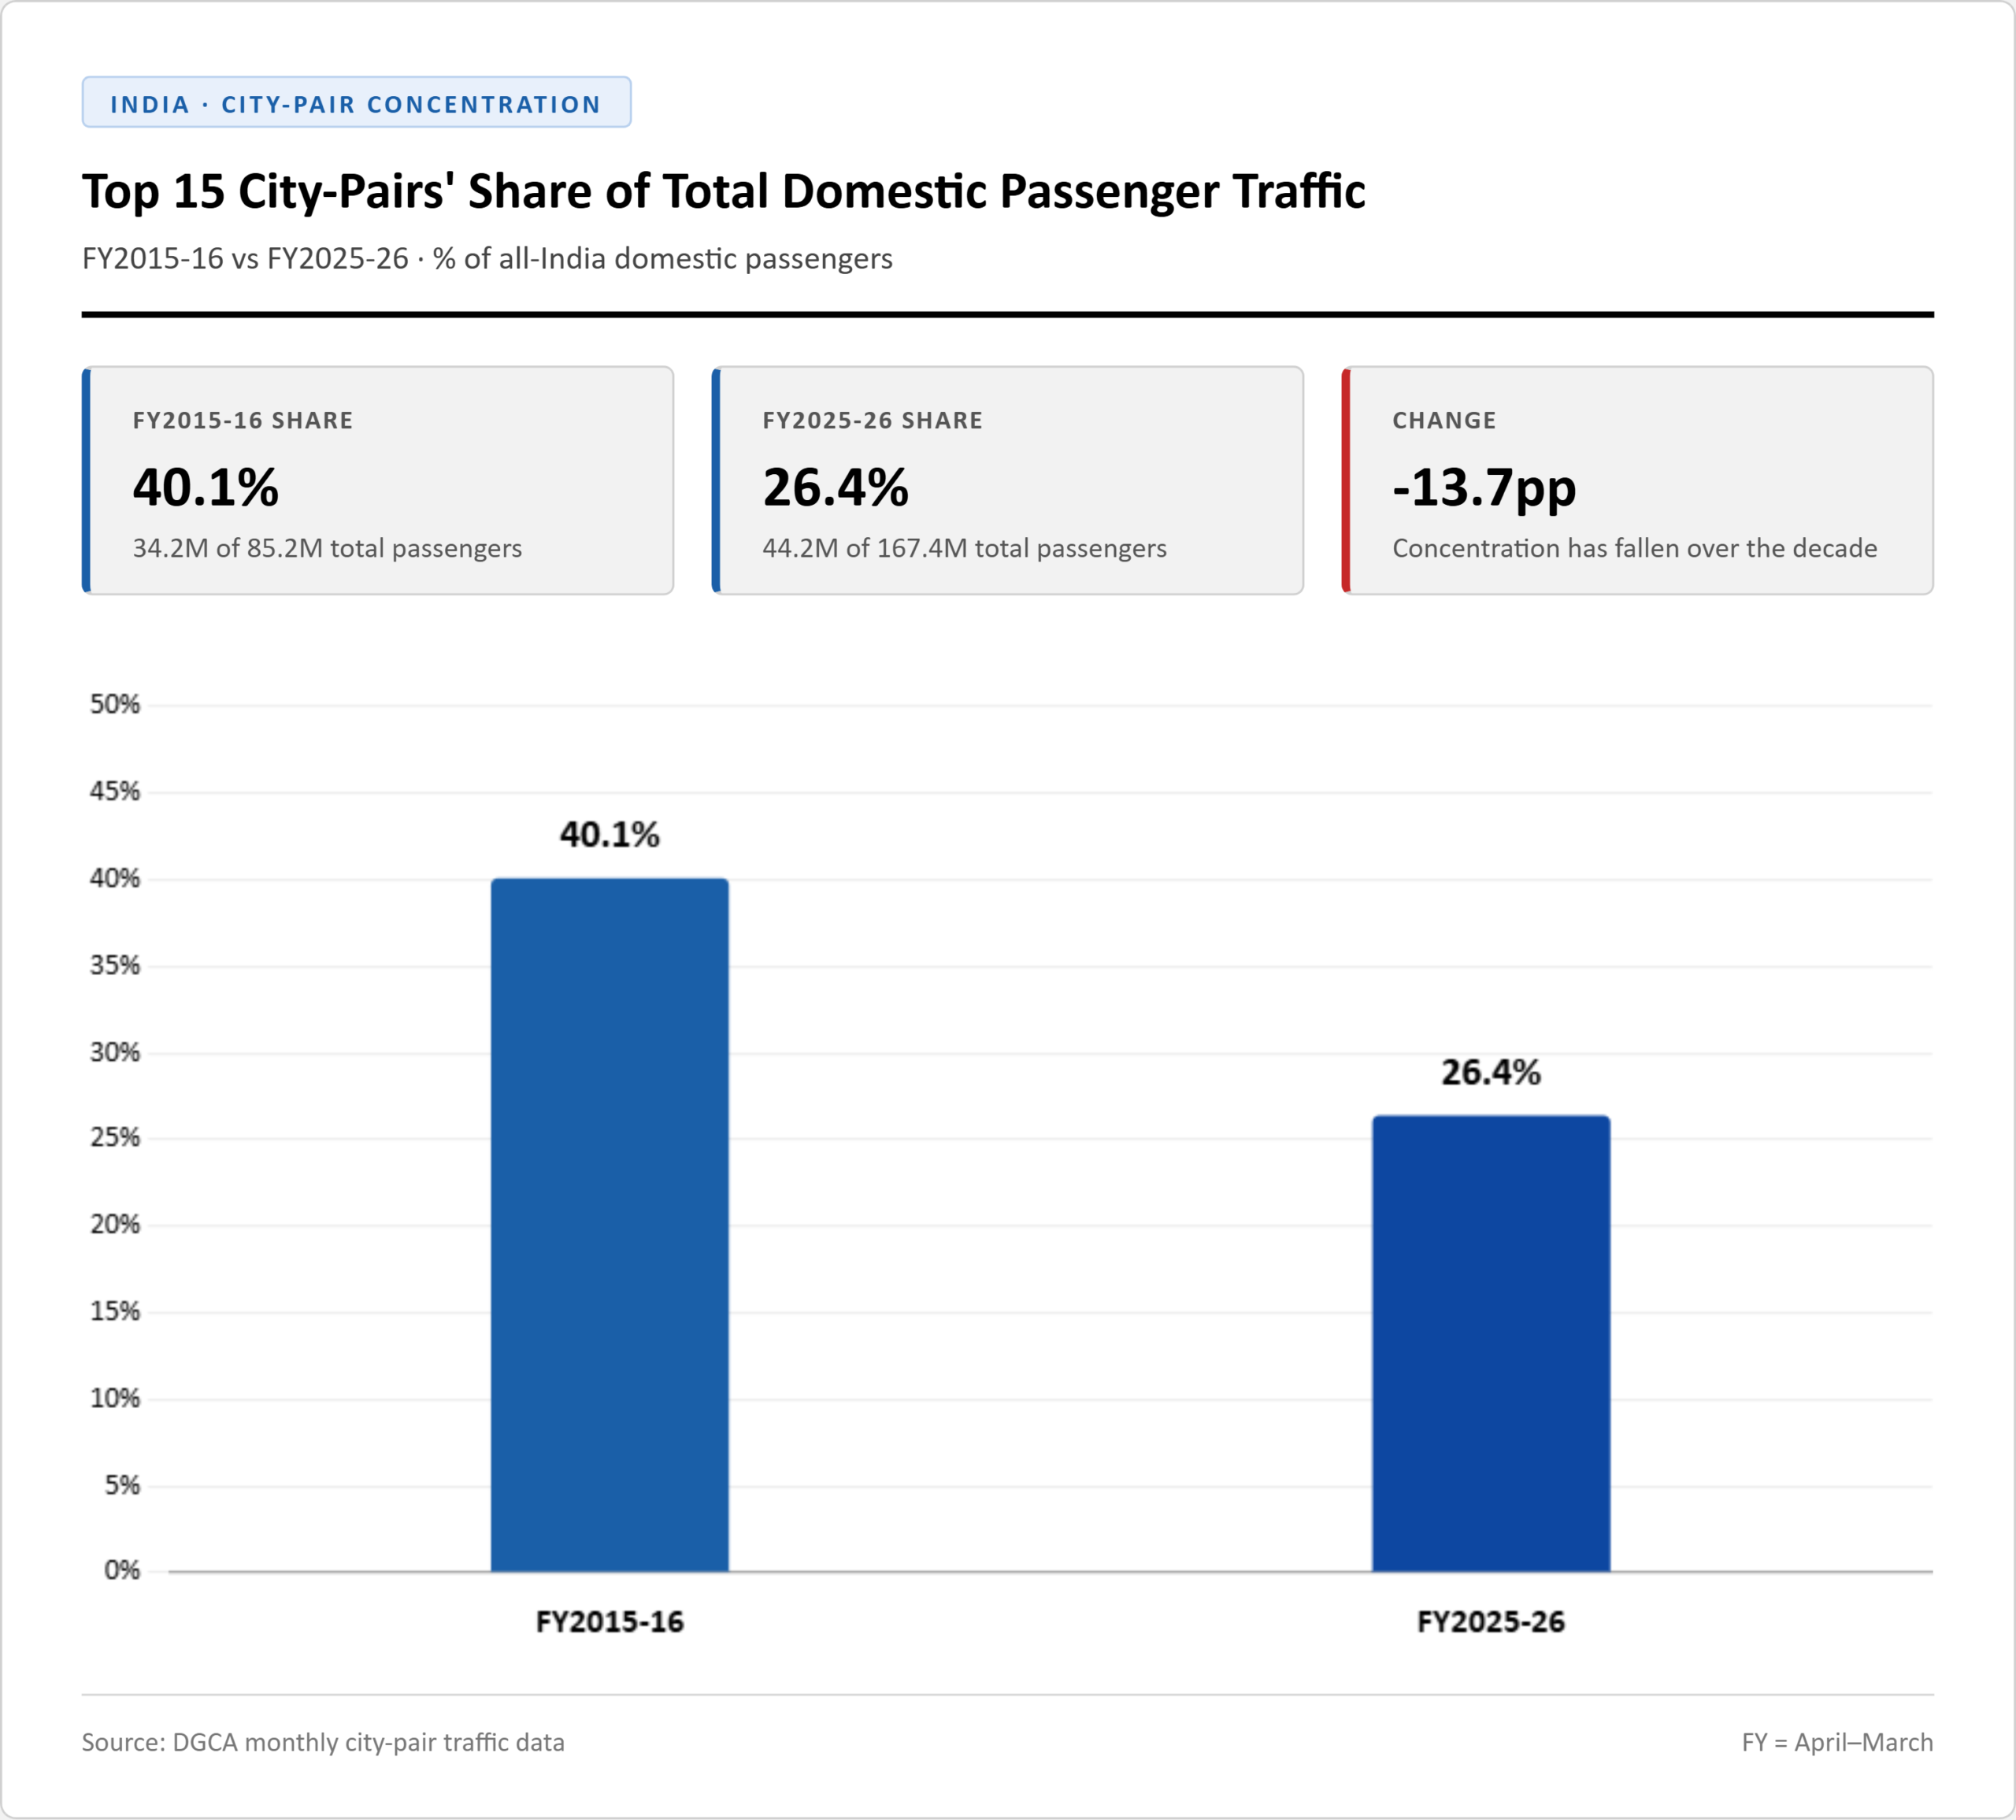
While regional connectivity was being built, the established domestic network was also expanding substantially. The Legacy network — the 357 pairs already flying before the UDAN scheme was deployed — grew from 85.2 million annual passengers in FY2015–16 to 158.4 million in FY2025–26, a 6.4 percent compound annual growth rate.
But the more interesting change is not simply the increase in passengers. It is the reduction in concentration. Delhi–Mumbai grew from 6.04 million to 6.49 million annual passengers over the decade, still comfortably the largest city-pair in the country, and Bengaluru–Delhi grew from 3.33 million to 4.75 million. It is that the rest of the network — Legacy and UDAN combined — is growing faster than the top 15 routes combined. Legacy average passengers per route held essentially flat: 238,600 in FY2015–16 versus 255,500 in FY2025–26. Traffic grew faster outside the handful of routes that historically dominated Indian aviation. The domestic market became both larger and more distributed.
Angle Three: Organic Growth Matters Too
The distinction between UDAN and non-UDAN regional growth becomes particularly clear when we look at airports such as Shirdi. Shirdi recorded effectively no scheduled passenger traffic in the FY2015–16 baseline. By FY2019–20, it was carrying approximately 595,000 annual passengers. Since FY2022–23, traffic has remained broadly within the 600,000–750,000-passenger range. At first glance, its curve resembles some of the strongest UDAN markets: almost no traffic, rapid expansion, and then a sustained high plateau.
But the attribution is different. Once airport infrastructure becomes available, strong underlying commercial demand can drive traffic growth organically — as demonstrated by one of India’s largest pilgrimage destinations. The underlying story is commercial demand meeting additional airport and airline capacity. Shirdi illustrates an important point: government-supported connectivity is only one mechanism through which India’s aviation map is broadening.
Avinia’s View
UDAN should not be judged against India’s largest trunk routes on passenger volume. That was never its purpose. The more relevant test is whether temporary support helped reveal markets with enough underlying demand to become commercially durable.
The route-level evidence suggests a mixed but useful outcome. Darbhanga, Jharsuguda, and Kanpur show that supported connectivity can uncover genuine demand and help a market acquire commercial depth. Prayagraj shows how strong underlying demand can coexist with event-driven spikes that need to be separated from the long-term trend. Pakyong, by contrast, demonstrates that strategic importance and initial connectivity do not automatically translate into a sustainable market.
Shirdi reinforces the attribution challenge from the opposite direction. Its growth resembles that of a successful UDAN market, yet its expansion was driven largely by strong commercial demand rather than RCS support. Similar traffic curves can therefore represent very different market-development stories.
The implication for the next phase of regional aviation policy is clear. Route launches are an input, not an outcome. The more meaningful measure is how quickly supported markets develop sufficient demand to sustain service, and how efficiently weaker markets are identified when repeated support fails to produce structural improvement. As Modified UDAN expands the programme further, the focus should increasingly shift from connectivity creation to connectivity graduation: how many routes move from policy-supported experimentation to commercially sustainable aviation markets.
The next phase of regional aviation policy should therefore be judged not by how many routes are launched, but by how many ultimately become markets that no longer need the policy that created them.
1 Ministry of Civil Aviation (MoCA).
Source: Draft — DGCA monthly domestic city-pair traffic data, FY2015–16 through FY2025–26; MoCA RCS-UDAN awarded routes list (679 routes, as on 4 July 2026).