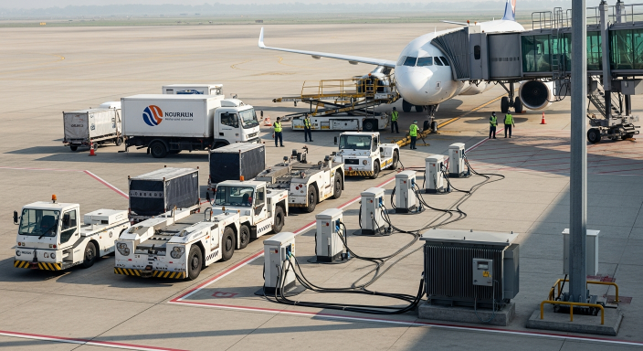
Ask an airport how it is approaching ground support equipment electrification and you will usually hear about chargers — how many, how fast, and which vendor. Ask the utility the same question and you will hear about something else entirely: the peak. The single number that governs the size of the electrical service, the transformer, the demand charge, and ultimately the feasibility of the whole programme is not only how much energy the fleet consumes over a year. It is how much power it draws in the worst fifteen minutes. That number is a property of the charging load profile — and the load profile is a choice, not a given.
That distinction is now backed by a modelling study. In a 2026 Nature Communications study1, Ge and colleagues built a bottom-up, agent-based simulation of electric GSE operations across 317 major US airports, using real flight arrival and departure data to schedule the service and charging events of eight equipment types — aircraft tractors, ground power units, baggage tractors, belt loaders, cargo loaders, catering trucks, lavatory trucks, and water trucks. The model generates minute-level charging load profiles for every airport under a range of charging strategies. Its central lesson for planners is insightful: the charging strategy, far more than the charger catalogue, determines what you have to build.
What the Load Profile Actually Looks Like
The study suggests that the magnitude scales sharply with airport size and, more precisely, with flight arrival volume. Large hub airports in the US see peak eGSE power demand ranging from roughly 1–2 MW up to 10–20 MW depending on the charging scenario; medium and small hubs generally sit below 5 MW; non-hub airports stay under 1 MW. Annual energy consumption at the largest airports approaches 51,000 MWh, with average daily consumption around 140 MWh. Peak demand tracks the arrival bank almost one-for-one — the busier the apron, the taller the spike.
The shape matters as much as the surge. Under opportunity-based charging — vehicles plugging in when their state of charge runs low, or immediately after each turn — demand is concentrated during daytime hours, riding the same curve as flight activity, then falling away from midnight to early morning before climbing again as operations resume. This is intuitive: the fleet charges when it works. It is also the profile most likely to coincide with the airport’s other electrical peaks, stacking eGSE demand on top of terminal HVAC and lighting at exactly the wrong time. One insight from the modelling worth flagging for design teams: ground power units alone account for nearly half of total eGSE energy demand, so any strategy that reduces or reshapes GPU load — gate electrification chief among them — moves the biggest single lever.
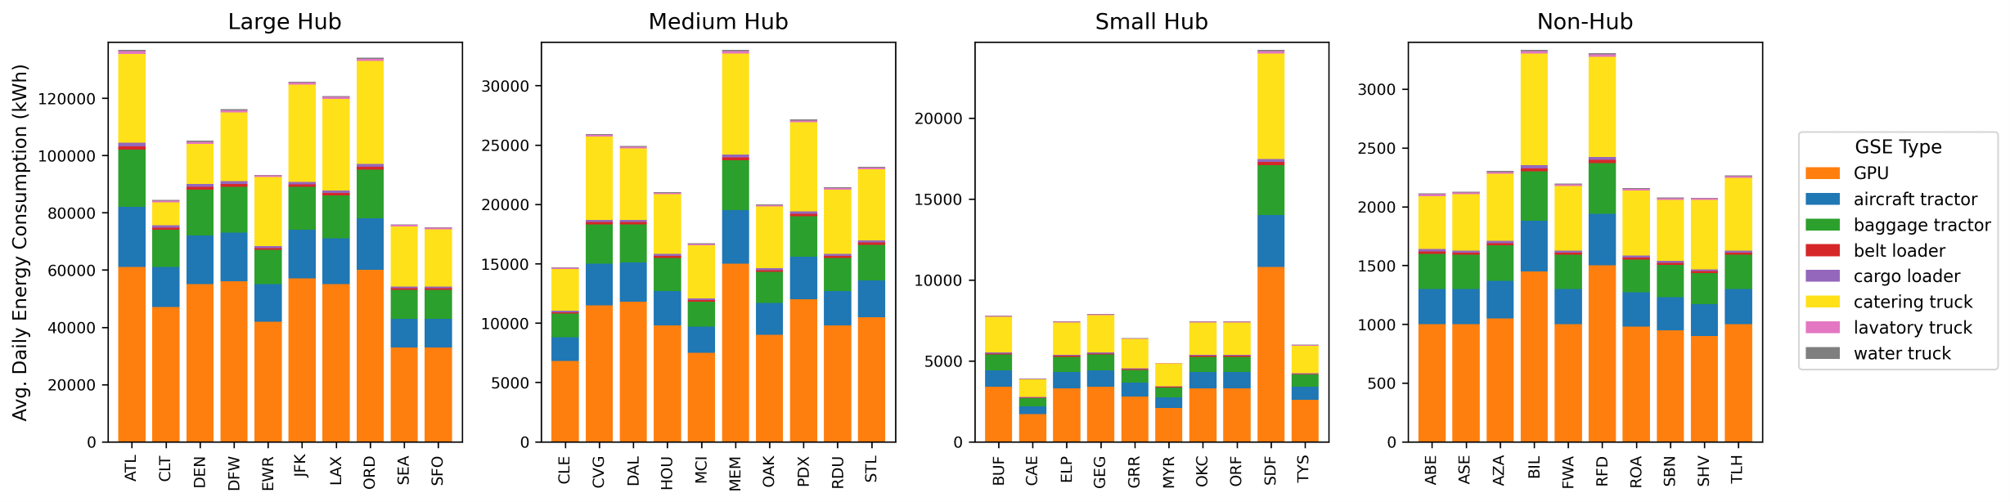
Source: Ge et al study
Note 1: GPU energy is used as a proxy for aircraft-related ground energy demand — powering onboard systems at gate or remote stand.
Note 2: Catering trucks represent a significant portion but can be excluded since they are mostly charged off airport.
Charging Strategy Is the Peak-Demand Lever
Here is the finding that should reorganise how airports plan: charging strategy has essentially no effect on total energy consumed, but a large effect on peak power demand and on the number of vehicles and chargers required.
The study compares three strategies. Threshold charging tops up a vehicle only when its charge is insufficient for the next task. Immediate charging plugs in after every service event; it produces similar timing to threshold charging but generally a higher peak, accelerates battery degradation, and needs more chargers. Scheduled overnight charging confines refuelling to a fixed off-peak window — typically around 10:00 p.m. to 8:00 a.m. Each produces a materially different load profile from the same underlying flight schedule.
The overnight strategy is the most counter-intuitive. It moves demand into the cheap, quiet hours when overall airport electricity use is low2 and, under time-of-use tariffs, energy prices and demand charges are typically lower — a genuine cost advantage. But because every vehicle is deliberately scheduled into one window, it tends to produce a higher in-window peak than opportunity charging unless the load is carefully spread across the whole off-peak interval, and it requires more chargers: a vehicle that discharges before the operational window opens is simply unavailable, so operators must add equipment to keep the apron running. Off-peak charging, in short, trades a lower-cost peak for higher capital in fleet and chargers — a trade that only pencils out if the demand-charge saving exceeds the extra hardware.
Charger Power Is the Other Dial
Charger power rating is the second design variable. Higher-power 40 kW chargers finish faster and need fewer units, but they concentrate draw and lift the peak. Lower-power 20 kW chargers spread the same energy over a longer period, flattening the profile and reducing peak demand for many airports — but they keep vehicles tied up longer, so the fleet needs more vehicles and more chargers to maintain the same operational tempo. There is no universally correct answer; the right charger power falls out of the airport’s own load profile, apron tempo, and demand-charge structure. Peak demand is something the planner dials in through the combination of strategy and charger power — not something handed down by the fleet size.
From Load Profile to Demand Charge — and How to Bend It
Translate the profile into a bill and the stakes are clear. The demand charge is set by the highest short-interval spike in the billing period, so two airports with identical annual energy can face very different monthly bills purely because of load shape. The key is to flatten the eGSE peak — staggered smart charging, load management, demand response coordinated with the utility, and deliberate scheduling across the off-peak window. There is also a powerful operational lever the study models explicitly: passenger boarding bridges that supply shore power and pre-conditioned air at the gate eliminate mobile ground power units at equipped stands, removing the single largest slice of eGSE energy demand from the charging load altogether and lowering both fleet size and peak3.
The most effective peak mitigation, though, is behind-the-meter. Using national modelling of storage and on-site solar, the study finds that adding battery energy storage and photovoltaics can cut GSE-related peak demand by roughly 20–50 percent and reduce life-cycle costs by 5–20 percent — with large and medium hubs seeing 20–30 percent peak reductions and smaller airports benefiting even more. Storage lets an airport charge the batteries in the trough and discharge them into the peak, decoupling the grid draw from the charging schedule entirely. For a large hub, that can mean shaving several megawatts off the peak and saving on the order of millions of dollars over the system’s life — often while deferring a costly transformer or substation upgrade.
In Brief: Where the Capital Goes
On a typical airport charging project the chargers, software, and maintenance are only about 10–30 percent of delivered cost, while 70–90 percent is the electrical make-ready — transformers, switchgear, feeders, and utility line extensions (industry estimates, RMI; based on US pricing). That is precisely why the load profile matters so much. Every megawatt of peak you design out through charging strategy, charger sizing, gate power, or behind-the-meter storage is a megawatt of expensive grid infrastructure you may not have to build. Managing the peak is not only an operating-cost play; it is the most direct way to manage the capital that has a direct impact on ROIC.
What the Leaders Are Doing
Boston Logan’s programme illustrates the charger-power dial in practice, deploying a tiered mix of 50 kW, 150 kW, and 350 kW DC fast chargers matched to duty cycle rather than defaulting every stand to maximum power — the practical expression of shaping the peak rather than chasing charge speed. Dallas Fort Worth shows the value of treating this as a modelling discipline: having run electric GSE at scale for the better part of a decade, DFW became a reference site for detailed electrification assessment work in 2025 that quantified site-specific power, charger, and infrastructure demands — exactly the minute-level, profile-driven analysis the study generalises to the national fleet.
The India Translation
Indian airports are on a tighter clock than most. MoCA has advised all operational Brownfield Airport and upcoming Greenfield Airport operators to work towards achieving Carbon Neutrality and Net Zero, which inter alia includes the use of 100 percent green energy. Delhi’s IGIA became the first Indian airport to secure ACI net zero carbon status, well ahead of its own target, with Delhi, Mumbai, Hyderabad, and Bengaluru all holding Level 4+ accreditation. Most ground support equipment at a large Indian airport is operated by ground handlers and airlines — Scope 3 for the airport operator. So DIAL can hold Level 5 net zero accreditation while the eGSE electrification problem remains almost entirely unaddressed on its apron. DIAL’s green transport programme is the largest airport EV fleet in the country.
Indian HT demand charges are levied against contracted capacity, not measured peak — directly on contract demand in Delhi, or through a floor set at a percentage of it in several other states. Under either structure, engineering a megawatt out of the load profile produces no saving until sanctioned load is formally revised with the DISCOM. In the United States the billing benefit follows the peak down automatically; in India it requires a counterparty. A peak you have designed out but not contracted out is a peak you are still paying for. Peak-shaving business cases built on US assumptions will overstate savings in India unless the contract-demand step is modelled explicitly.
The second consideration is that India’s time-of-use signals are real but comparatively thin. Gujarat applies a peak surcharge of INR 0.45 per kWh between 07:00–11:00 and 18:00–22:00 for consumers above 10 kW contract demand; Tamil Nadu adds 25 percent to energy charges in peak hours with a rebate for overnight consumption. Those are meaningful margins on a 51,000 MWh annual load, but they are a fraction of the ToU spreads that make US overnight charging compelling. Combined with the ratchet, the balance of advantage in India tilts away from the overnight strategy — which demands more vehicles and more chargers — and towards threshold or managed opportunity charging with active load control, where peak is shaped continuously rather than displaced wholesale into one window.
The third is the one that most favours Indian airports: behind-the-meter generation is further advanced here than almost anywhere. Cochin International has run on solar since 2015 and now operates around 50 MW generating some 73 million units annually, avoiding roughly 66,000 tonnes of CO₂ a year. Open access, captive, and group-captive structures give Indian airports procurement routes that US airports simply do not have, and Adani’s 19.3 GW renewable portfolio sits inside the same group as India’s largest private airport concession platform — an internal supply relationship no US operator can replicate. Where the US study finds 20–50 percent peak reduction from storage and PV, an Indian airport with captive solar and a battery sized against the arrival bank should be able to reach the upper half of that band — and, crucially, use it to justify a lower contract demand at the next tariff review. That is where the money is.
Avinia’s View
Electrification should be designed backwards from the load profile. Before selecting a single charger, an airport should model its own minute-level eGSE demand from its actual flight schedule, then treat charging strategy and charger power as the primary levers for shaping the peak — not as procurement afterthoughts. Prefer opportunity or threshold charging with active load management where daytime grid headroom exists; use scheduled off-peak charging where time-of-use tariffs genuinely reward it, but size the fleet and chargers for the window. Electrify gate power to strip out GPU load. And wherever the peak is large, evaluate behind-the-meter storage and solar early, because a 20–50 percent peak reduction can defer the very transformer and substation upgrades that dominate project cost. For Indian operators, run the contract-demand negotiation in parallel with the engineering, not after it. The charger is the visible part of electrification. The load profile is the part that decides whether it is affordable.
1 Ge, Y., … Lunacek, M. (2026). Energy, power, and infrastructure demands from electrifying airport ground support equipment at United States airports. Nature Communications, 17, Article 4612. https://doi.org/10.1038/s41467-026-71125-4
2 This is not necessarily true of 24-hour operational Indian airports.
3 GPU energy is used as a proxy for aircraft-related ground energy demand — powering onboard systems at gate or remote stand.