India's airlines are buying back the 15-year growth trend. Passengers have not caught up yet. Airports have to plan for both.
India's airlines placed their orders for a market growing at 8% a year. The aircraft are now arriving. The market, for the moment, is not growing at all. We set the Indian carriers' fleet induction plan against our demand model, updated with traffic to September 2026. The supply line runs ahead of what the market will deliver, that gap will shape airport capacity, airline fares and airport revenue for the rest of the decade.
A Market That Has Paused
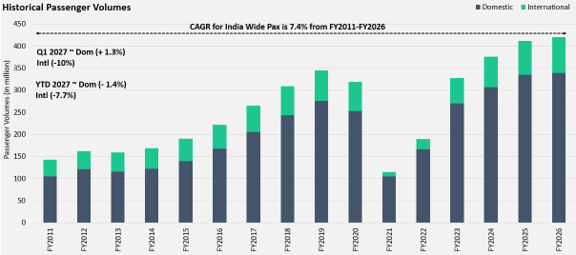
The underlying trend is strong. India-wide traffic grew from 143 million passengers in FY2011 to 420 million in FY2026, a compound rate of 7.4% a year. Domestic grew at 8.1%, international at 5.2%. Even the pandemic only interrupted the curve. Traffic was back above its FY2019 peak by FY2024.
FY2026 broke the pattern. Total traffic grew just 2.1%, domestic only 1.5%. FY2027 has started worse. Between April and September 2026, domestic traffic fell 2.2% year on year to 159.3 million, and international fell 7.1% to 36.7 million. The second quarter was weaker than the first, with domestic down 5.9%. September alone came in 6.0% below the previous year. The causes are known: Air India's capacity cuts and the Gulf disruption none of them is a collapse in the propensity to fly. Together, though, they have taken a full year of growth out of the market.
The Fleet Is Coming Anyway
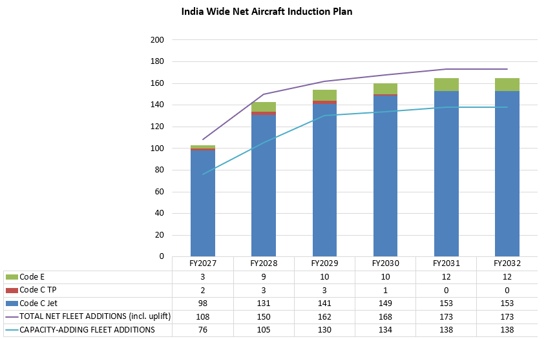
Source: Avinia Labs induction model based on OEM production rates and airline order books
Fleet plans run on a different clock from traffic data. Our induction model is built from Airbus and Boeing production rates and each airline's share of global orders. The key rates are about 52 A320neo-family aircraft a month in 2026, 45 737 MAX a month at stable state, eight 787-9s a month from 2026 and 60–70 A350s a year. The model puts total net fleet additions at 108 aircraft in FY2027, 150 in FY2028, 162 in FY2029 and 168 in FY2030, levelling off at 173 a year from FY2031. The capacity-adding share, aircraft that grow the network rather than replace retirements.
Narrowbodies dominate. Code C jets make up 98 of the 108 additions in FY2027 and 149 of 168 in FY2030. Widebody Code E additions are small but rise quickly: 3 in FY2027, 9 in FY2028, then 10 a year. That step-up is IndiGo's 60 A350-900s, with deliveries starting at the end of 2027, on top of Air India's long-haul renewal.
The airlines' own plans are bigger. IndiGo plans to add 350+ aircraft, excluding leases, to reach 750–800 by 2030. Air India expects 182 net additions, more than 80% of them Code C. We discount these plans by 15–20% for retirements and delivery slippage, then add 5–10% of confirmed orders for wet leases and new regional airlines. On that basis, Indian carriers grow their fleet by 87% by FY2030, to around 1,529 aircraft.
How Firm Is the Supply Line?
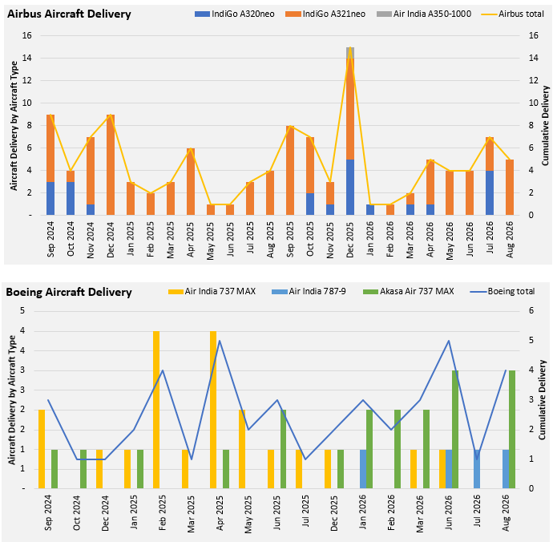
Source: Airbus and Boeing delivery records, Sep 2024–Aug 2026; Avinia Labs analysis
It is tempting to treat the fleet plan as the certain number. The delivery record says it is the most ambitious number in the analysis. Over the past 24 months, Airbus delivered an average of 0.92 A320neo and 3.8 A321neo a month to IndiGo, plus one A350-1000 to Air India. Boeing delivered 1.63 737 MAX a month to Air India and Akasa combined, plus a 787-9 to Air India roughly every six months. That is about 6.5 aircraft a month, or around 79 a year.
The plan needs 108 net additions in FY2027 and 150 in FY2028. Net means after retirements, so gross deliveries must be higher still. These delivery figures cover three carriers' direct OEM deliveries only; leased-in aircraft, wet leases and other carriers add to them. Even so, the recent run rate covers roughly 73% of the FY2027 requirement and just over half of FY2028's. Deliveries are also lumpy. December 2025 brought 15 Airbus deliveries; May and June 2025 brought one each. The supply line is firm in direction. Its timing is not.
Supply Meets Demand
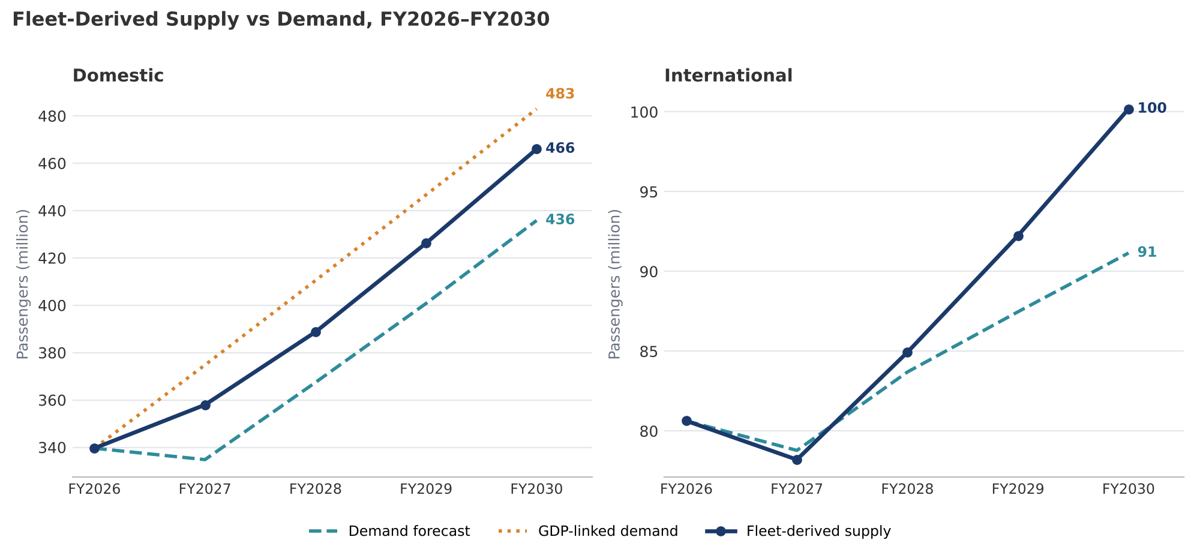
Source: Avinia Labs fleet-derived supply and demand model, Sep-2026 run
We convert the fleet plan into passenger supply and set it against two views of demand. The first is our demand forecast, built from monthly AAI traffic since April 2010 with COVID months masked out and updated with actuals to September 2026. It takes the current dip into FY2027 and then returns the market to growth. The second is a regression of traffic on India's GDP growth, which assumes the market returns straight away to its historic relationship with the economy.
| Fiscal Year | Domestic Supply (m pax) | Domestic Demand (m pax) | Domestic Supply vs Demand | International Supply (m pax) | International Demand (m pax) | International Supply vs Demand |
|---|---|---|---|---|---|---|
| FY2027 | 357.9 | 334.8 | +6.9% | 78.2 | 78.8 | −0.7% |
| FY2028 | 388.7 | 367.4 | +5.8% | 84.9 | 83.7 | +1.5% |
| FY2029 | 426.2 | 400.8 | +6.4% | 92.2 | 87.5 | +5.5% |
| FY2030 | 466.0 | 435.8 | +6.9% | 100.2 | 91.2 | +9.9% |
Supply vs demand = fleet-derived supply relative to the Avinia demand forecast. FY2027 includes Apr–Sep 2026 actuals.
Domestic: a steady lead, not a widening one. Fleet-derived supply reaches 357.9 million passengers in FY2027, up 5.4% on FY2026, while our demand forecast falls 1.4% to 334.8 million. That opens a 6.9% gap in the first year. From there, both lines grow at about 9% a year: demand recovers to 367.4 million in FY2028 and 435.8 million in FY2030, and supply reaches 466.0 million. In practice, the fleet runs eight to nine months ahead of the passengers in every year of the outlook. The surplus is set by FY2027 and then carried forward.
The GDP line explains the orders. The GDP-linked view sits above supply in every year: 374.8 million in FY2027, 410.5 million in FY2028, 446.7 million in FY2029 and 482.9 million in FY2030, between 3.5% and 5.3% above the fleet. The fleet plan sits between our two views of demand. So the airlines have ordered for a market that returns to its historic link with GDP. Domestic supply grows at 8.2% a year to FY2030, almost exactly the 8.1% the market delivered over FY2011–FY2026. The fleet plan is a bet that FY2026–27 is a pause, not a reset. The GDP line's FY2027 figure (+10.4%) is already out of reach. It would need second-half growth of about 22% after a negative first half. The bet now rests on FY2028 onwards.
International: from balance to a 10% surplus. International supply falls 3.0% in FY2027 to 78.2 million as the Gulf disruption and Air India's cuts take capacity out. Our demand forecast for FY2027 is 78.8 million, so supply sits 0.7% below demand, effectively in balance. Then the widebodies arrive. Supply grows 8.6% a year to 100.2 million by FY2030, while demand grows about 5% a year to 91.2 million. Supply moves ahead by 1.5% in FY2028, 5.5% in FY2029 and 9.9% in FY2030. Unlike domestic, the international gap widens every year. International capacity is lumpier than domestic because it rides on a small widebody base, so each A350 batch moves the line more than an equivalent narrowbody batch would. The timing is set by delivery slots, not by how international demand evolves.
How the Gap Closes
A 6–7% domestic surplus is not a crisis, but it is enough to move fares, and it lasts for four years. Something gives. There are four ways the gap closes, and each lands on airports differently.
Fares fall. Indian air travel is highly price-sensitive. Surplus seats get sold cheaply, and cheap seats create passengers. This is how supply partly makes its own demand. Airports get the passengers, but at lower airline yields and lower spend per head in the terminal.
Capacity moves. Surplus narrowbodies shift to short-haul international routes and to tier-2 and tier-3 cities. Smaller airports see growth they did not plan for, often at off-peak and early-morning times.
Utilisation falls. Airlines fly aircraft fewer hours, park them or return leased aircraft early. Airports then see more aircraft than flights. The demand shows up on the apron, not in the terminal.
Deliveries slip. OEM delays and engine shortfalls impose the capacity discipline the airlines would not. On the recent run rate, this is the most likely route in FY2027–28.
In practice it will be a mix. But every route ends at the airport: in passenger yield, in stand occupancy or in the timing of capacity needs.
What It Means for Airport Capacity
Nationally, airport capacity is not the binding constraint. With Navi Mumbai and Noida opening in FY2026, capacity at the six major metros is planned to grow by 140+ million passengers a year by FY2030. The fleet plan adds about 146 million passengers of supply over the same period, and our demand forecast adds about 107 million. In aggregate, the metros alone can absorb nearly all of it.
The constraint is local, and it is about timing. DEL and BOM are already full. As we set out in this month's first Featured Insight, Mumbai's regional capacity bottoms out at about 60 million passengers a year in October 2027, after Terminal 1 comes down and before the new capacity arrives. That is the middle of FY2028, the year net fleet additions jump from 108 to 150. The aircraft will not wait for the terminal. They will go where there is room: Navi Mumbai, Noida and tier-2 airports that can offer slots and stands.
Stands are the real near-term pressure point. Every net aircraft added needs somewhere to park overnight, and the plan adds about 590 aircraft between FY2027 and FY2030. Those night-stop positions fall on airline bases and on outstations with early-morning departures. If utilisation falls to absorb surplus capacity, stand demand rises, not falls. Code E is the second pressure point. About 32 widebody additions by FY2030 need Code E contact stands, international processing capacity and long-haul slot times, concentrated at a handful of gateways.
Avinia's View: Build Airside to the Fleet, Phase Landside to the Market
The fleet plan and the demand model are each right about different things. The fleet tells you what will land. Demand tells you what it will earn. Airports should plan on four principles.
First, build airside to the fleet. Apron, night-stop stands and Code E positions should be sized to the committed fleet trajectory. The fleet needs these assets whether or not the passengers turn up, and they bind first if utilisation drops.
Second, phase landside to the market. Split terminal expansions into modules, each released by observed traffic, not by the calendar. A workable rule: commit the next phase when trailing twelve-month traffic tracks our demand forecast, and accelerate only when it moves clearly towards the fleet line. The design stays ready without building ahead of a market that is currently shrinking.
Third, set revenue on the demand forecast. Tariff submissions, concession minimum guarantees and retail spend models should use the demand forecast, never the supply line. Under AERA's methodology, a traffic over-forecast lowers today's per-passenger tariff, and the shortfall is only trued up in the next control period. The cash gap in between is the airport's to carry. Retail and F&B bids built on supply-line footfall will not clear.
Fourth, watch the supply line every month. Delivery counts, load factors and fares are the leading indicators. If deliveries hold near 80 aircraft a year, the gap closes on its own. If they jump to the plan's 150, expect fare pressure through FY2028 and plan for it.
Conclusion: Plan for the Aircraft, Pay for the Passengers
India's airlines have bought a return to trend. The orders were placed for an 8% market, and the aircraft will arrive whether or not the market cooperates. Domestic supply runs 6–7% ahead of our demand forecast in every year to FY2030, and the international surplus widens to 10% as the widebodies land. The gap will close through cheaper fares, redeployed and idle aircraft, or slower deliveries, and most likely all of them.
For airports, the lesson is to keep the two numbers apart. Plan the airside to the fleet. Phase the terminal and the revenue model to the market. The airports that do both will be ready for the aircraft without paying for passengers who have not yet arrived.
Source: Avinia Labs analysis of AAI India-wide monthly traffic (Apr 2010–Sep 2026), Avinia demand forecast and GDP-linked model (Sep-2026 run), OEM production rates, airline order books and Airbus/Boeing delivery records (Sep 2024–Aug 2026)